Contents
Share
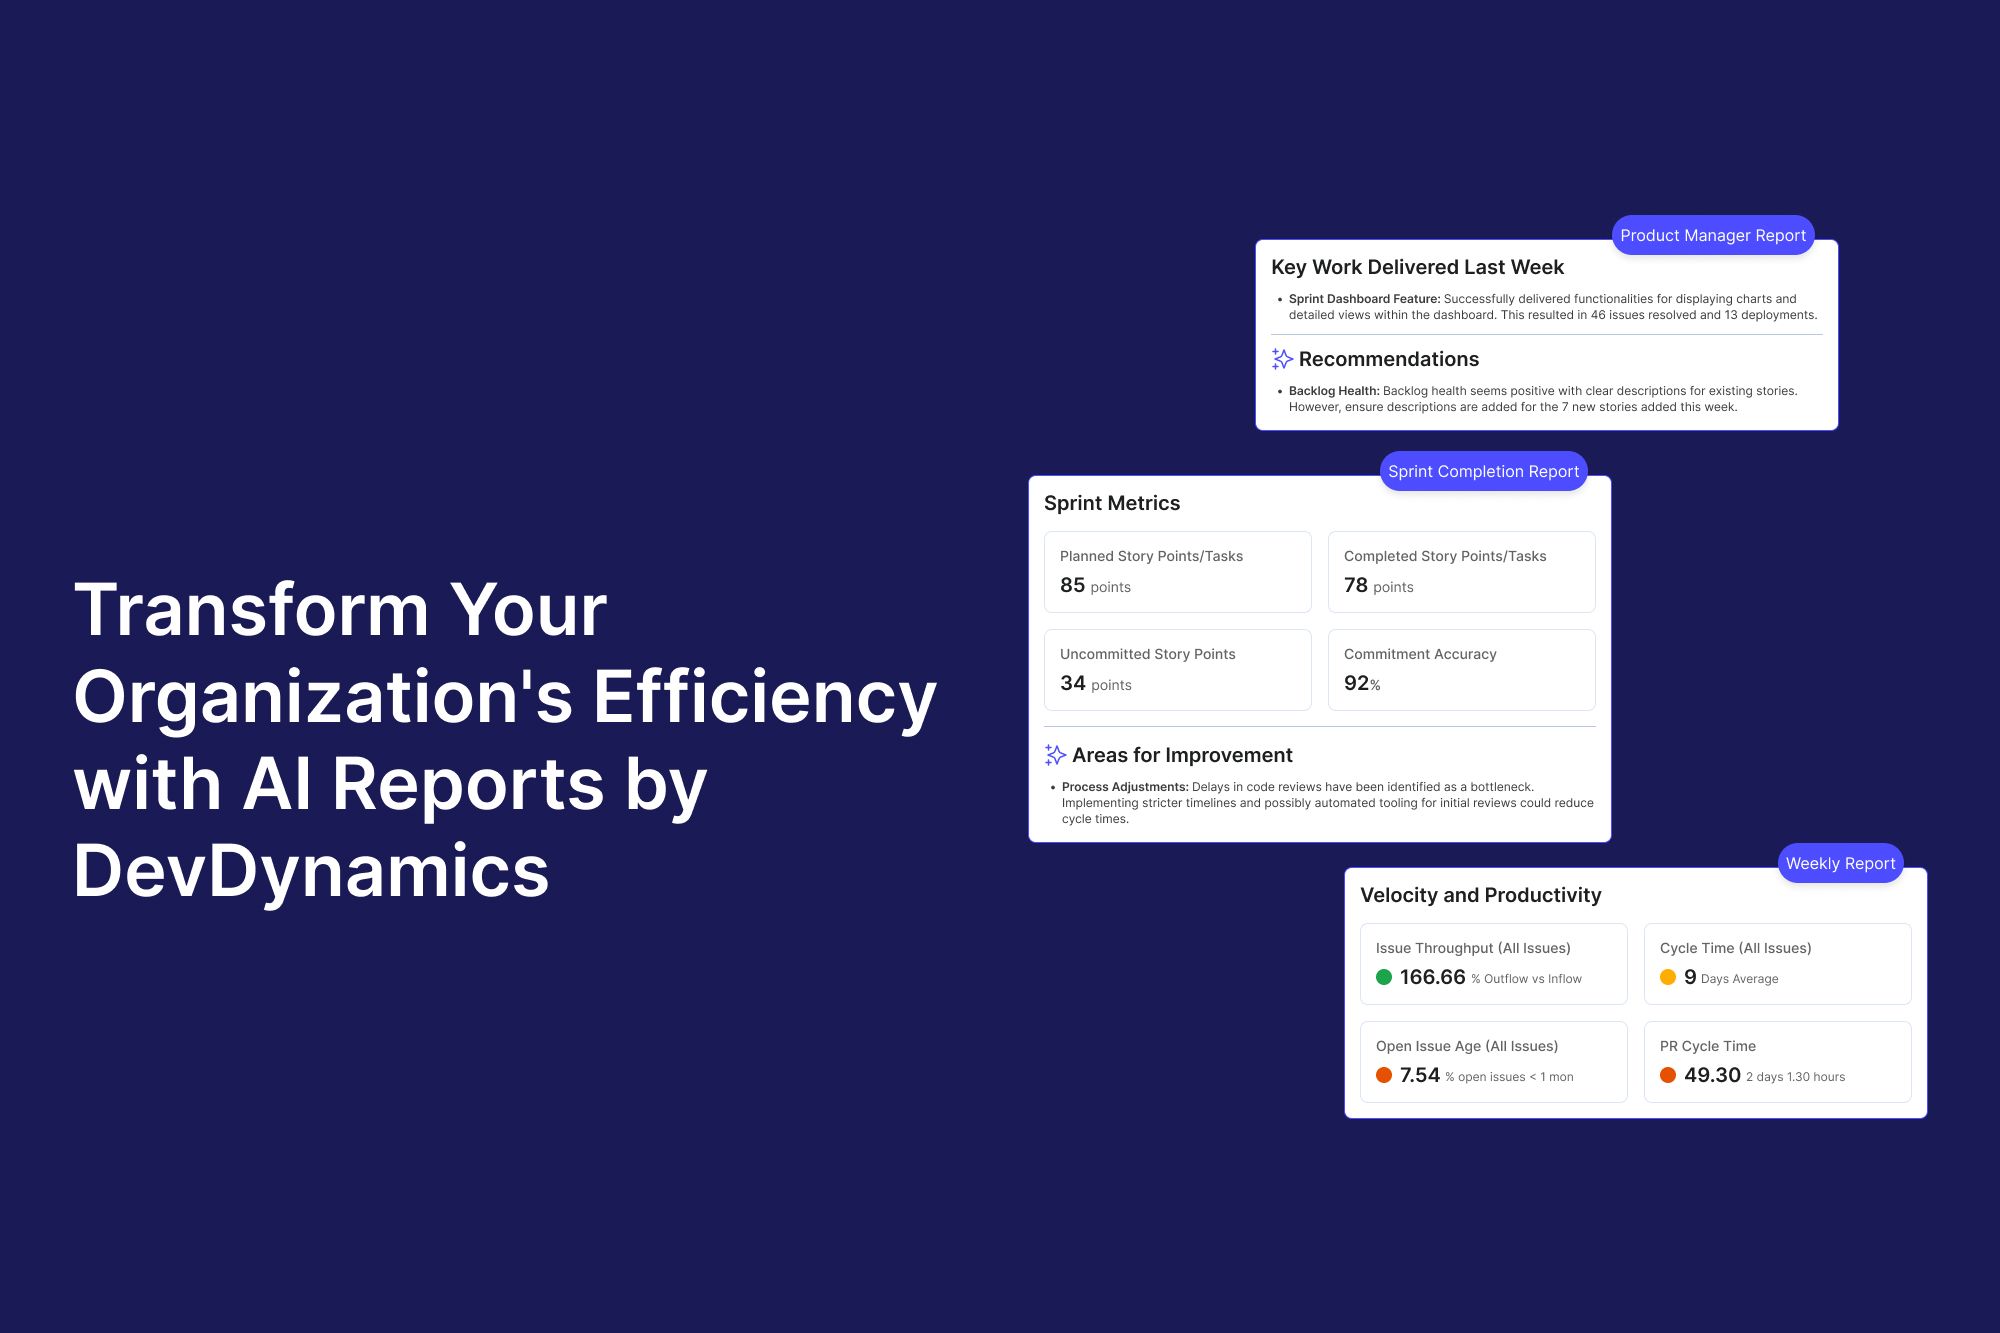
Transform your organization's efficiency with AI reports by DevDynamics
Unlocking organizational potential with AI-enabled weekly reports
Envision a tool that furnishes a detailed, easy-to-understand analysis of your organization's performance every week. As a CTO, VP, CEO, or Engineering Manager, you require insights that empower you to make smart decisions to propel your company forward. DevDynamics offers precisely that with its AI-enabled weekly Reports, transforming data into actionable insights.
What are AI-enabled reports?
DevDynamics AI-Enabled Reports delve deep into the core operations of your organization. They meticulously analyze crucial metrics like deployment frequency, lead time for changes, recovery speed after issues, and more. These reports go beyond surface-level data, providing a detailed look at the factors that drive your business's performance. Understanding these metrics can unlock a wealth of insights, helping you streamline processes and enhance overall efficiency.
Why do comprehensive reports matter to leaders?
In the rapidly evolving business landscape of today, leaders need to have accurate and timely insights to make smart decisions. With the massive amount of data being generated every day, it can be overwhelming to find meaningful information quickly. That's where comprehensive reports come in.
They play a crucial role in summarizing huge amounts of data into actionable insights. Not only does this save time, but it also helps identify trends, assess risks, and seize opportunities promptly.

By providing a straightforward and digestible format, these reports enable leaders to maintain focus on strategic objectives and make well-informed decisions that drive the organization forward. This clarity is essential for prioritizing initiatives, aligning them with strategic goals, and ensuring the entire organization is moving in the right direction.
Benefits of comprehensive AI reports
Reduced decision-making time
Comprehensive reports simplify the decision-making process by presenting all necessary information in a straightforward format. Leaders can quickly understand the current state of operations without navigating through complex dashboards.
Enhanced clarity and focus
These reports emphasize key metrics and insights, allowing leaders to zero in on what truly matters. This enhanced focus aids in prioritizing initiatives and aligning them with strategic goals.
Simplified communication
With clear and concise reports, leaders can easily communicate performance and insights to stakeholders, ensuring everyone is on the same page.
Informed strategic planning
By providing a holistic view of the organization’s performance, comprehensive reports enable leaders to make data-driven decisions that drive long-term success.
Why dashboards are not enough
Dashboards provide a valuable, detailed view of your operations, allowing for deep dives into specific areas. They offer various data points and can be customized to show granular details. However, without the right context, the extensive data presented in dashboards can be challenging to interpret and act upon quickly.
Comprehensive reports complement dashboards by synthesizing this detailed data into a coherent narrative. While dashboards are excellent for drilling down into specific metrics, comprehensive reports distill the key information into an easily digestible format that provides a broader, contextual understanding of organizational performance.
Think of dashboards as the intricate layers of your data landscape, providing detailed views that are crucial for in-depth analysis. In contrast, comprehensive reports act as a panoramic overview, summarizing critical insights and trends that guide strategic decision-making. This combination ensures that leaders can both understand the minute details and see the bigger picture, allowing for informed and effective actions.
Glimpse of a few key metrics from the DevDynamics Report
Understanding the metrics behind your operations is crucial. DevDynamics' reports focus on several critical performance indicators, including the DORA metrics:
Deployment frequency
This is a measure showing how many times your team is able to release a new update or even new functionality to production. This is basically a measurement of how well your team is delivering value to your users.
Use Case:
A high frequency of deployment means your team can quickly respond to user feedback, shifts in the market, and new opportunities that emerge. This agility is critical for keeping ahead of the competition and continuously improving your product.
Lead time for changes
This metric assesses the speed of your development process from the moment a developer starts working on a change until it's available to users.
Use case
Short lead times indicate a smooth and efficient development process, allowing your team to quickly implement and release improvements or fixes. This helps reduce time spent on marketing and enhances the team's ability to adapt to new requirements.
Maintaining high standards with quality and team health
Quality assurance, team health, and tracking burnout symptoms are pivotal to sustaining high performance. DevDynamics’s AI reports provide metrics that help maintain these standards:

Mean time to recovery (MTTR)
MTTR measures the average time to recover from a production failure, including the time it takes to detect, diagnose, and fix the issue.
Use Case
A low MTTR indicates effective incident management and resolution processes. This metric is crucial to maintaining the high availability and reliability of your services, ensuring the least disruption for your users.
Change failure rate
Change failure rate is a percentage metric of changes to production that result in failure. For example, a service outage or service degradation represents a failure.
Use case
A low rate of failed changes is a sign of robustness in your deployment and testing processes. a high rate of successful implementations without issue, which is a factor in building and maintaining user confidence and application stability.

Enhancing productivity and efficiency
Keeping an eye on productivity metrics helps identify areas for improvement and resource allocation:
Issue throughput
Issue throughput measures the rate at which your team addresses and resolves issues, including bugs, tasks, and user stories.
Use Case
High issue throughput indicates that your team is effectively managing and closing issues, contributing to a smooth and efficient workflow. It also reflects the team's capacity to handle workload and maintain productivity.
Open issue age
Open issue age tracks the average age of unresolved issues. It helps you understand how long issues have been lingering without resolution.
Use Case
A low open issue age suggests that your team promptly addresses issues, preventing backlog accumulation and technical debt. This ensures that problems are resolved before they escalate, maintaining the overall health of the project.
PR cycle time
PR (Pull Request) cycle time measures the time taken to review, approve, and merge a pull request. It is a critical aspect of the code review process.
Use Case
Short PR cycle times indicate an efficient code review process, ensuring that new code is integrated swiftly. This helps in maintaining momentum and minimizing delays in the development workflow.
Conclusion
DevDynamics AI-enabled Reports are more than mere compilations of numbers; they offer a view into the health and effectiveness of your organization. Such insights through key metrics and actionable takeaways enable you to make data-driven choices so that performance can be maximized. The clear and concise presentation of critical data ensures that you can focus on strategic objectives and prioritize initiatives effectively.

Incorporating these AI-enabled reports into your routine allows for better communication with stakeholders, smooth decision-making processes, and informed strategic planning. These reports not only help in identifying and mitigating risks but also in seizing new opportunities, ensuring your organization remains agile and competitive in the ever-evolving business landscape.
