State of DevOps Report 2024: New Metrics to Watch
The 2024 State of DevOps Report (DORA) feels like an important wake-up call for engineering leaders. Every year, Google Cloud and some of the top DevOps minds put this report together to give us a map to make better decisions. But this year’s report goes deeper. It pushes us to rethink how we measure success, adding new metrics that go beyond speed and stability toward something more impactful and lasting.
The Core of DevOps
For years, we've used the Four Key Metrics to understand software delivery:
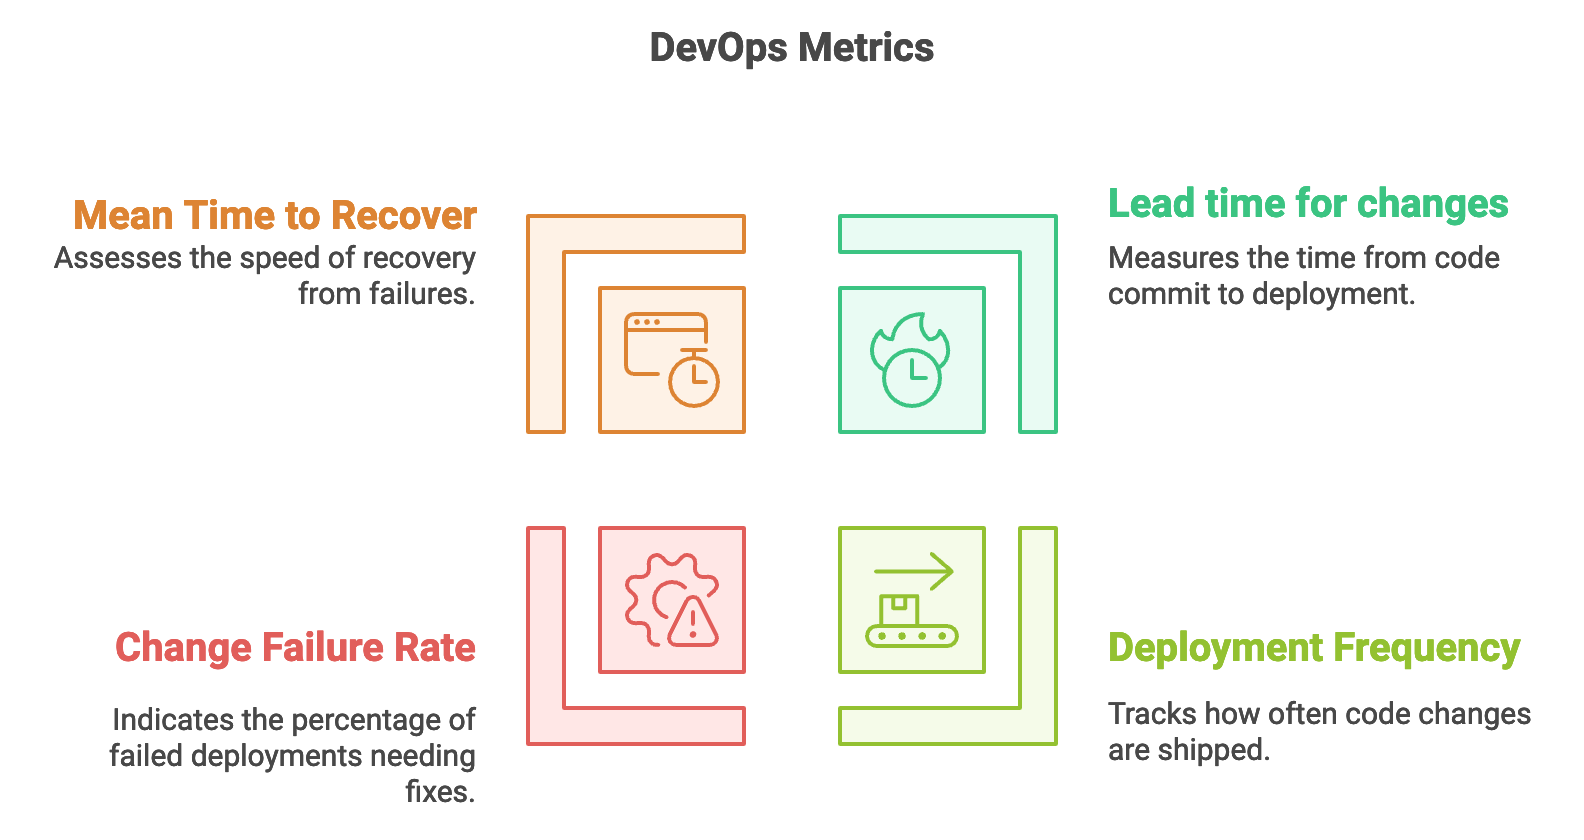
- Lead time for changes: How long it takes from code commit to deployment.
- Deployment frequency: How often you ship code changes.
- Change failure rate: The percentage of deployments that fail and need fixing.
- Mean Time to recover (MTTR): How quickly you recover from a failure.
These metrics are good for measuring efficiency and stability. But modern engineering problems are more complex. We need a deeper understanding of what drives long-term success.
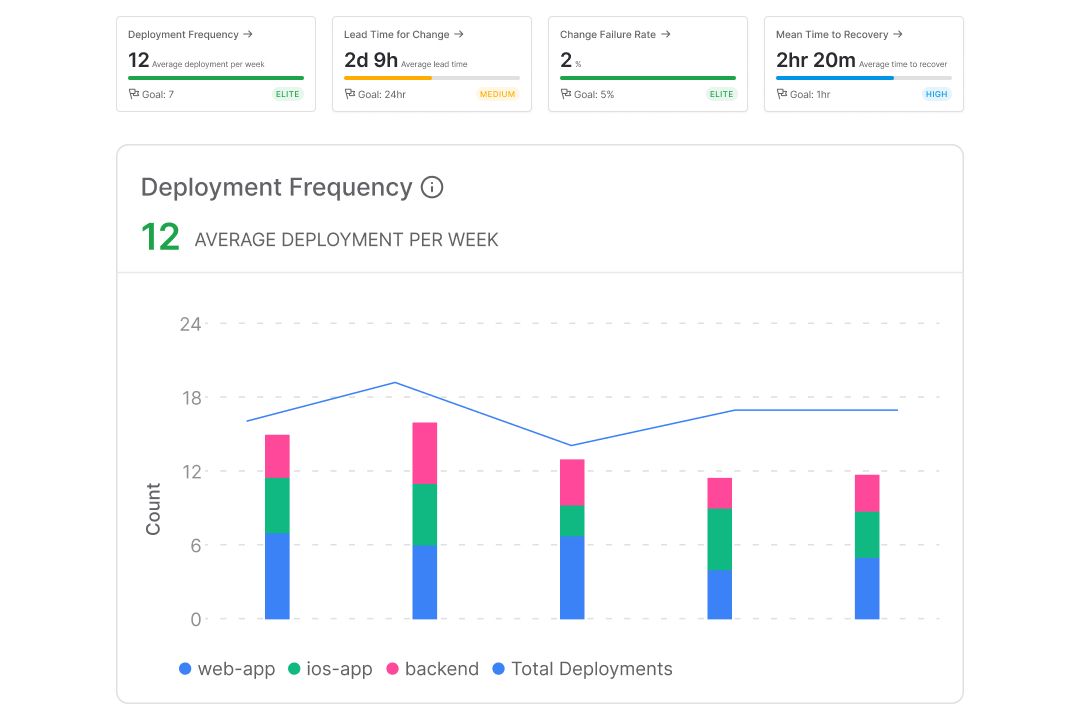
With DevDynamics, teams can track these Four Key Metrics effortlessly, while also gaining deeper insights into code quality, team efficiency, and bottlenecks. The platform allows engineering leaders to monitor these traditional metrics in real time and take proactive measures to improve performance.
Broader perspective: Rework Rate and User Feedback
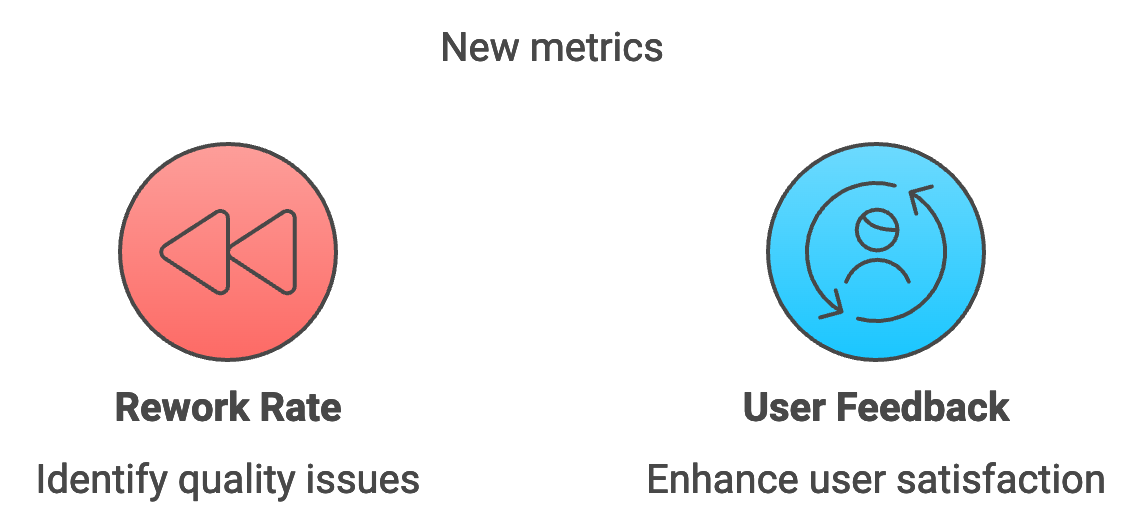
The 2024 report discusses Rework Rate:
Rework Rate: Measures how often you have to go back and fix things after deployment.
- Why It Matters: High rework means you’re sacrificing quality for speed. It adds technical debt and increases costs in the long run.
- How to Use It: Track rework alongside change fail rate to understand where the real problems are and fix them at the source.
The report also emphasizes on User Feedback Metrics. Metrics like Net Promoter Score (NPS), usability scores, and customer satisfaction help you see the impact of your work on end users.
Integrating Technical, Business, and User Metrics
The report pushes for integrating different types of metrics:
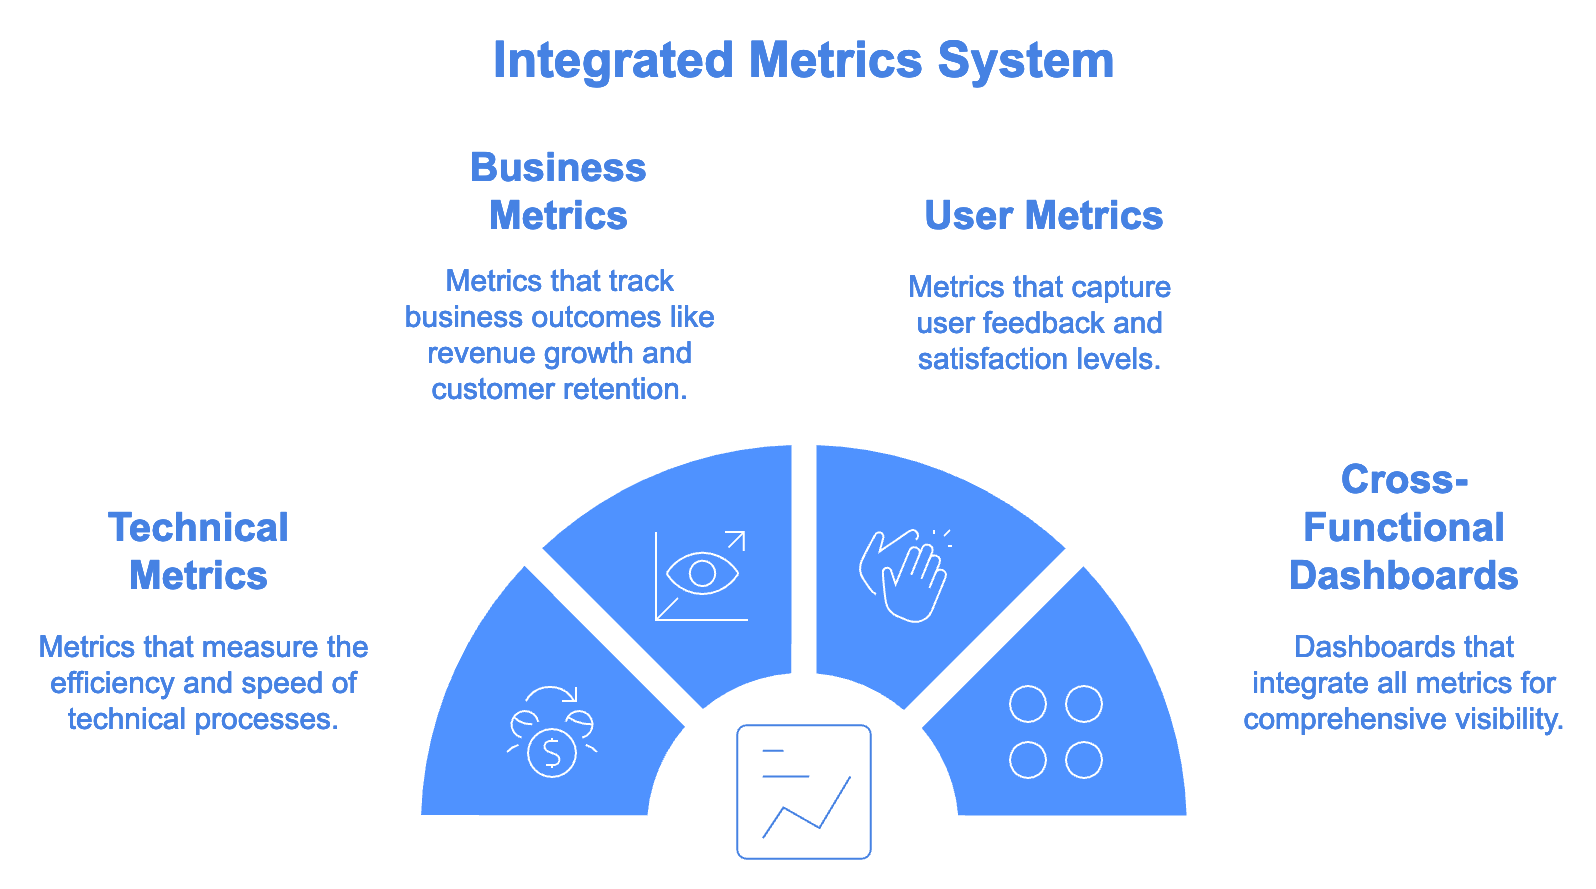
- Technical Metrics + Business Metrics: Look at technical metrics like Lead time for changes alongside business metrics like revenue growth or customer retention.
- Why This Matters: You need to show how engineering work drives business outcomes. This helps justify investments in tooling and improvements.
- Cross-Functional Dashboards: Combine technical, business, and user metrics in one place. This makes it easier for everyone from engineers to execs to see how engineering impacts the organization.
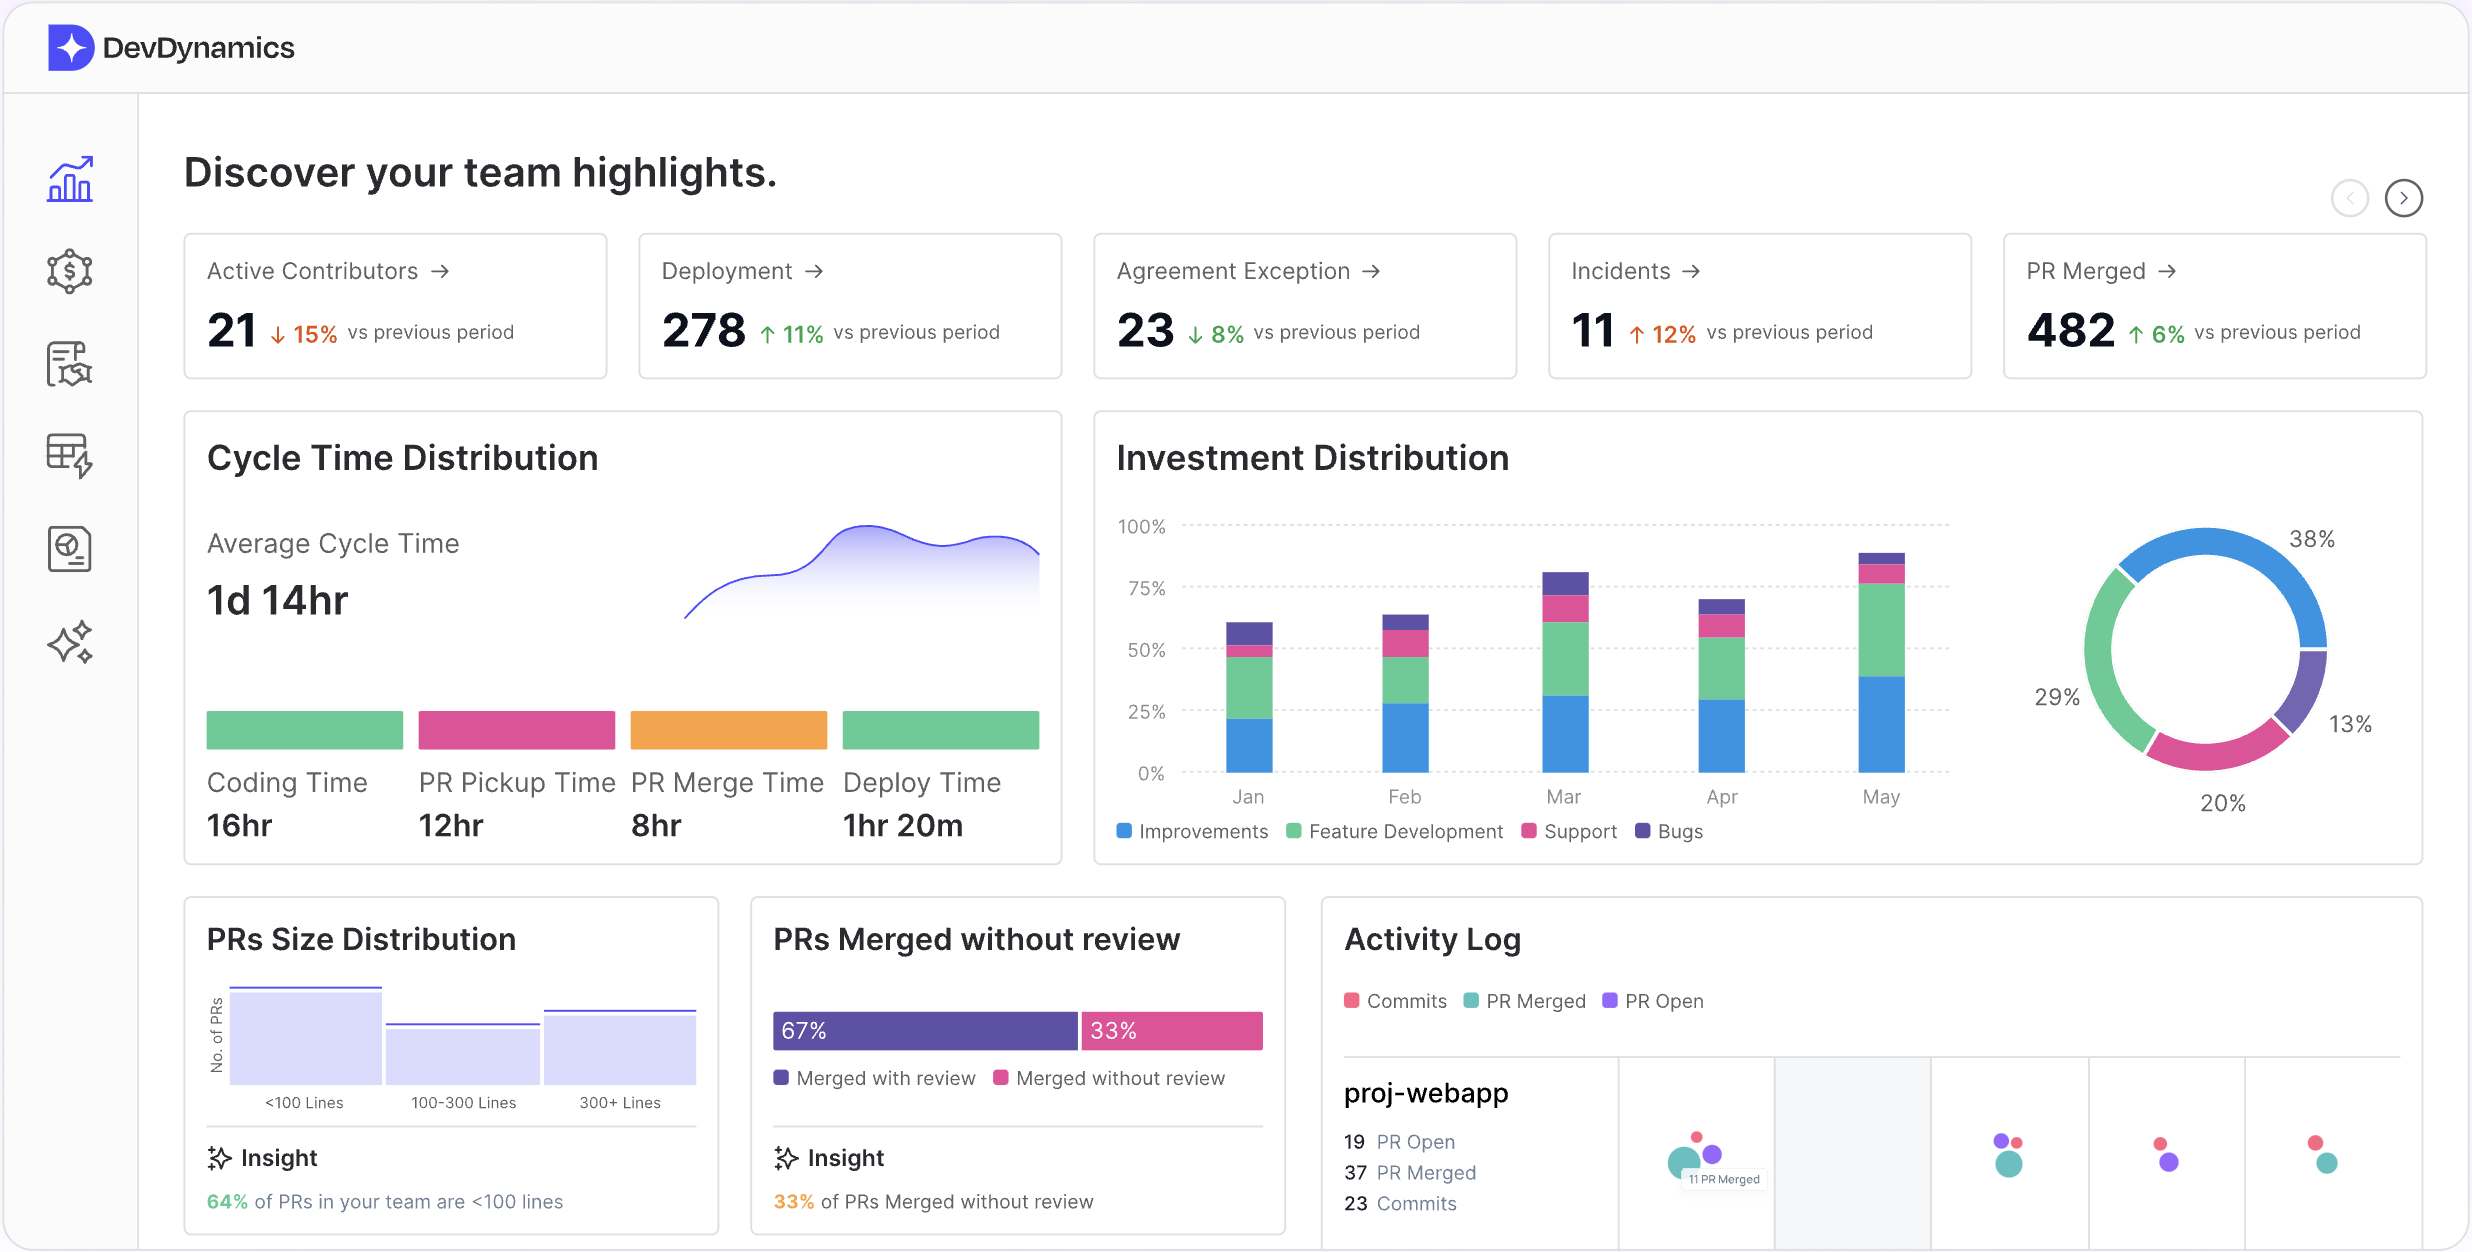
DevDynamics enables cross-functional dashboards that bring together technical, business, and user-centric metrics. This integration allows engineering leaders to see how code deployments, development cycles, and technical improvements directly impact business results like revenue growth and customer engagement.
Artificial Intelligence is reshaping software delivery, but it’s not all upside:
- The Good: AI can boost productivity, improve code quality, and take on repetitive tasks freeing up your engineers to solve the tough problems.
- The Bad: Over-reliance on AI can hurt throughput and stability. Less than half of developers fully trust AI-generated code. It’s a tool, not a silver bullet.
- The Takeaway: Use AI wisely. It can help, but human oversight is critical to maintaining quality.
Developer Experience and Team Health: The Human Element
Metrics on Developer Experience and Team Well-being are more important than ever:
- Why It Matters: Burnout is real. Overworked teams don’t just lose productivity, they make mistakes. Keeping developers engaged and healthy is crucial for sustainable success.
- The Metrics: Satisfaction scores, burnout indicators, and psychological safety surveys help keep a finger on the pulse of your team.
- Actionable Insight: Rising burnout? It’s time to rethink workloads, staffing, and culture. A happy developer is a productive developer.
Platform Engineering: Productivity vs. Stability
Platform engineering empowers developers, eliminates friction, and helps your organization scale effortlessly.
What Platform Engineering Really Does: Imagine a world where developers don’t waste time chasing approvals or waiting on tickets. Platform engineering builds that world - a centralized, self-serve system that gives developers instant access to everything they need to write great code.
Managing Trade-Offs: A rigid platform can become a nightmare. The key is balance - your platform has to evolve as your team evolves. It must be scalable and adaptable. Give developers what they need, when they need it, without stifling them. Keep the guardrails, but don’t overdo it.
That’s how you build a resilient, high-performing team that can scale with your business.
The Future of DevOps Metrics
The 2024 DORA Report is a guide for engineering leaders who want to build resilient, high-performing teams that deliver real value:
- Think Bigger: Moving beyond the traditional Four Key Metrics helps you add value across all areas - user satisfaction, business impact, and team health.
- Communicate Impact: With a broader set of metrics, you can clearly communicate your team’s value to the business, align engineering efforts with strategic goals, and drive continuous improvements.
- Build for the Long Run: Metrics that focus on quality, user experience, and developer well-being aren’t just about today - they’re about building a sustainable, innovative team for the future.
DevOps isn't just about speed or stability; it's about real impact. Build software that matters, focus on value, and create teams that are truly empowered. Success isn't just fast delivery it's meaningful progress. Rethink the metrics. Measure what genuinely drives value. That's how we build something that lasts.

