Inside the Developer Profile: The Ultimate Guide to Understand Your Dev's Impact

Engineering leaders juggle countless priorities: tracking progress, maintaining balance, driving team growth, and meeting deliverables. The Developer Profile feature is designed to help engineering managers provide actionable feedback to their engineers, ultimately improving engagement and supporting developers in their growth. Conducting one-on-ones without data risks letting biases creep in. It offers a clear view of each contributor's work, strengths, and growth areas, giving you all the insights you need in one place.
Let’s break it down.
1. The Who, What, and Where

At the top of the Developer Profile, you get a quick view of:
- Top Coded Languages: What languages they’re strongest in.
- Knowledge Areas: The parts of the system where they contribute most.
- Teams: What squads or projects they’re actively a part of.
It’s a quick check for aligning the right developer to the right project. Know their strengths, expertise, and focus areas.
2. Activity Overview: The High-Level Snapshot
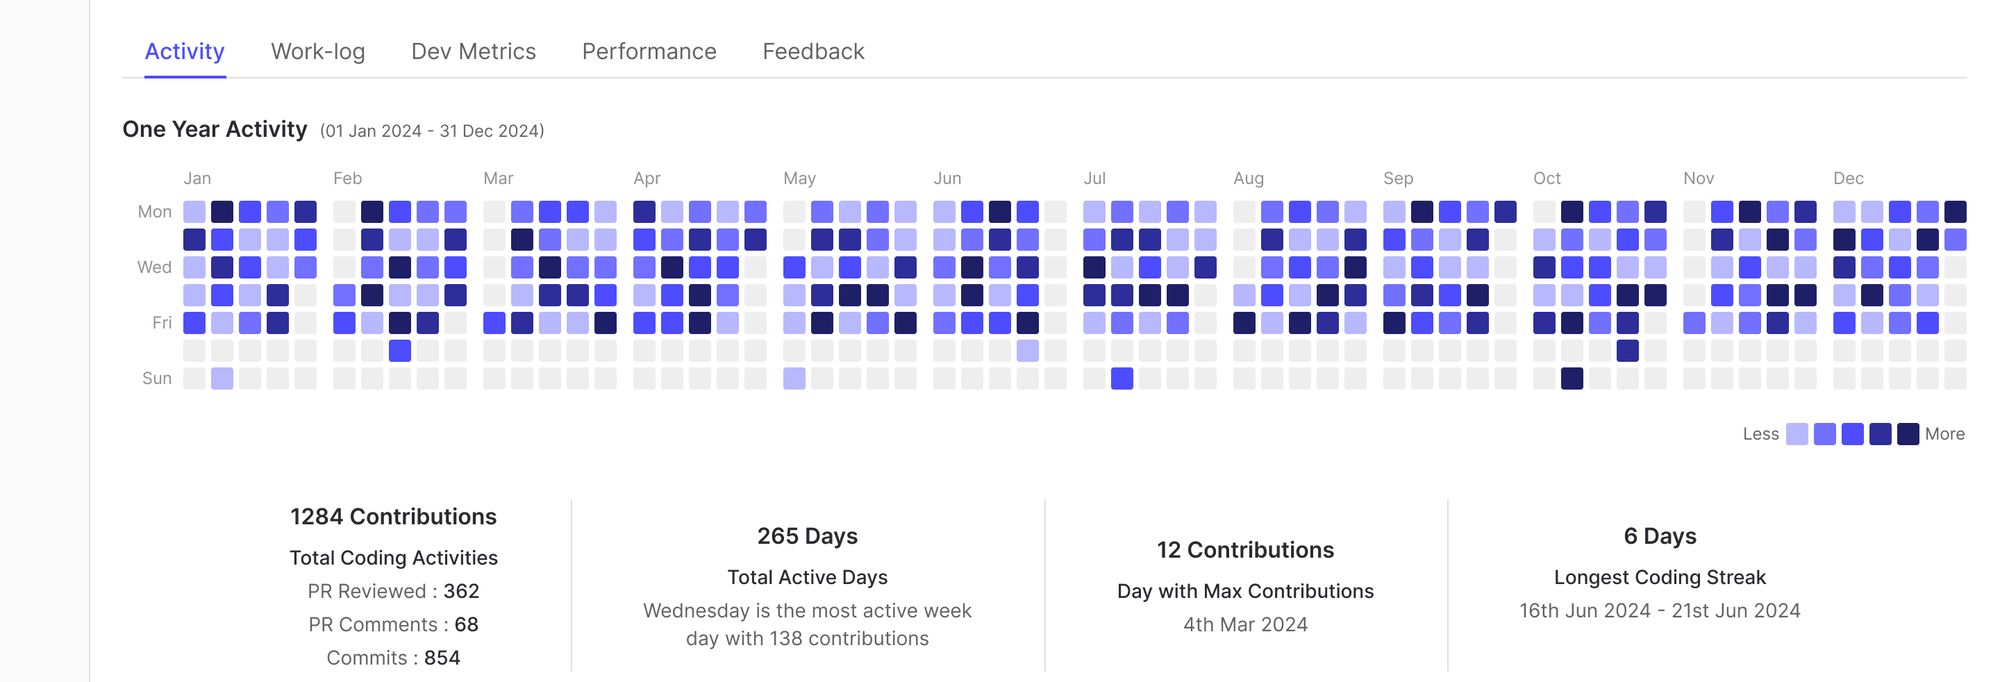
The Activity tab is the starting point, it’s where you see a developer’s rhythm and overall activity over time. Think of it as the heartbeat of their work.
Activity Heatmap:
- A clear, visual summary of daily contributions across 12 months.
- Instantly spot trends: consistency, peaks, and quiet zones.
- A simple but powerful view to answer “Are they consistent? Are there unusual dips?”
Key Highlights:
- Total Contributions: PRs, commits, and code activities.
- Most Active Days: Their most productive times—know their cadence.
- Longest Streaks: When they’ve been ‘in the zone’ and firing on all cylinders.
Understand how individual efforts contribute over time and identify when someone might need support.
3. Work Log Transparency
Think of this as the most detailed breakdown of what’s happening when. You get a day, week, and monthly timeline of key activities:
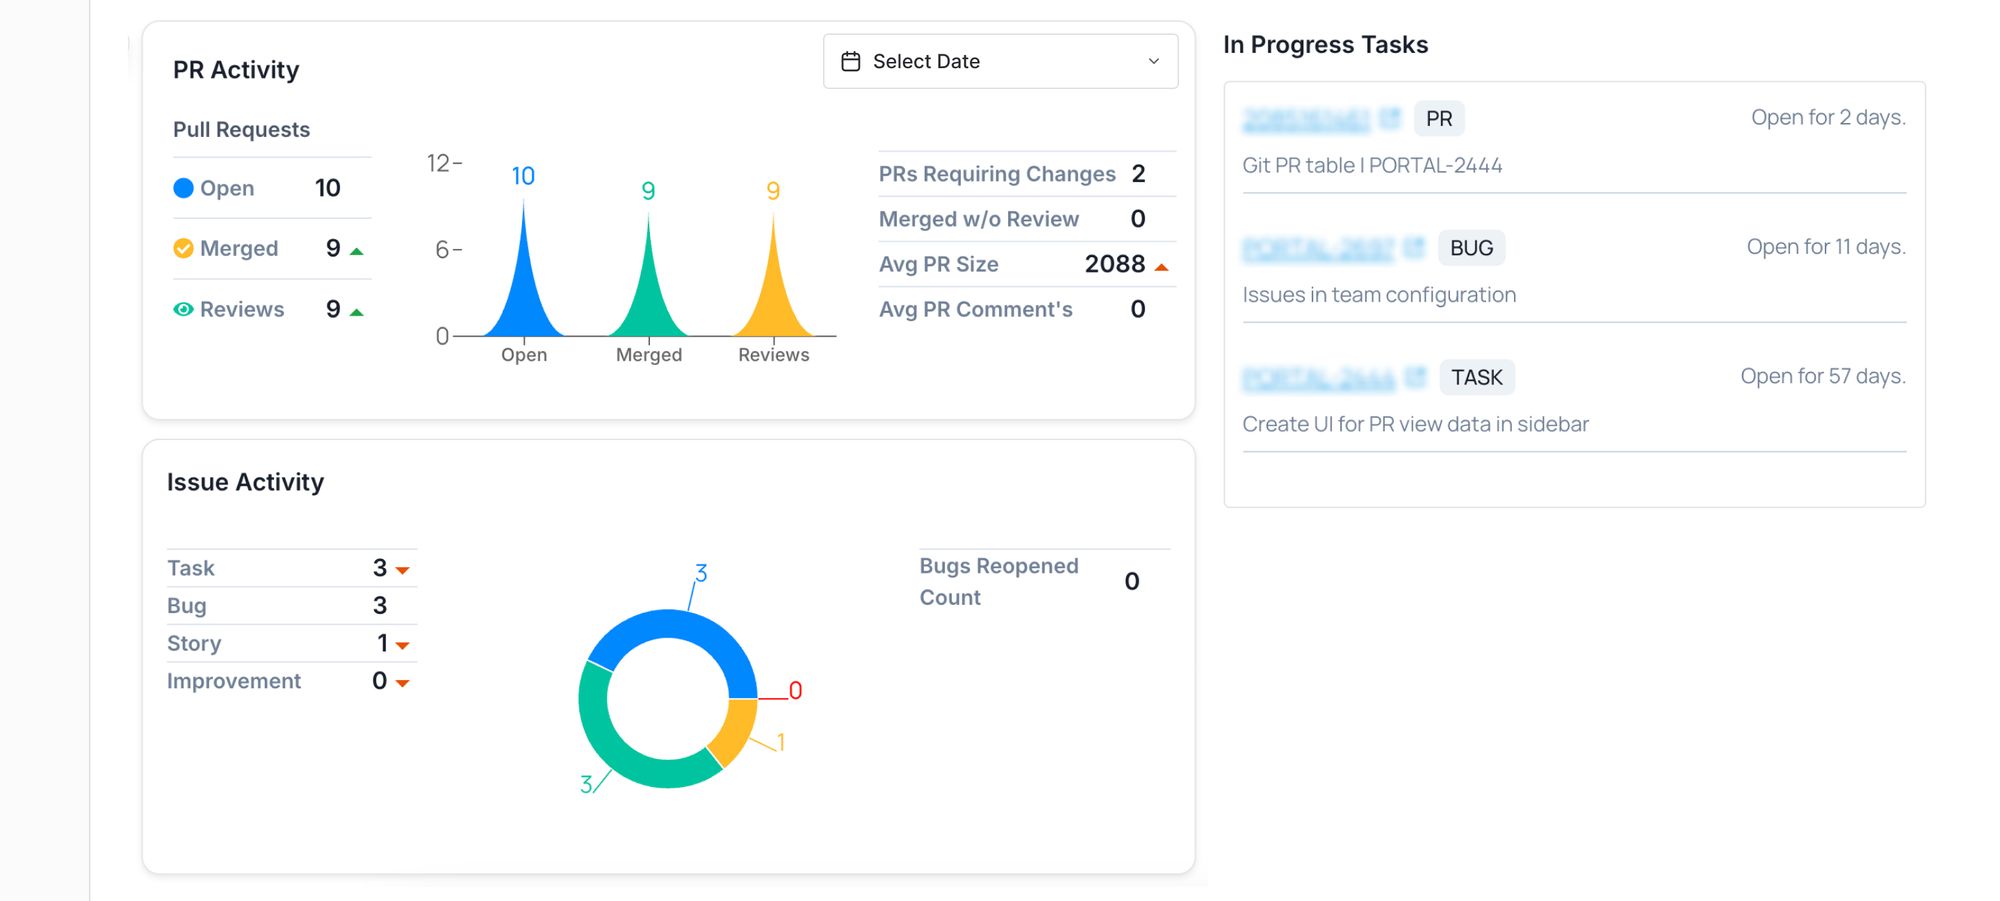
Commits and PRs:
- See the PRs opened, reviewed, and merged.
- Know their pace and progress at a glance.
Issues & Bugs:
- Track issue resolutions and where bottlenecks might be emerging.
Meeting Time:
- Balance is critical. Too much time in meetings? The work log highlights it.
Use this to prepare for 1:1s. Walk into conversations with the full picture: what they shipped, where they’re stuck, and how much time is being spent coding vs. in meetings.
4. Developer Metrics: Coding Practices and Patterns
This section is where you’ll see how a developer is performing, beyond raw output.
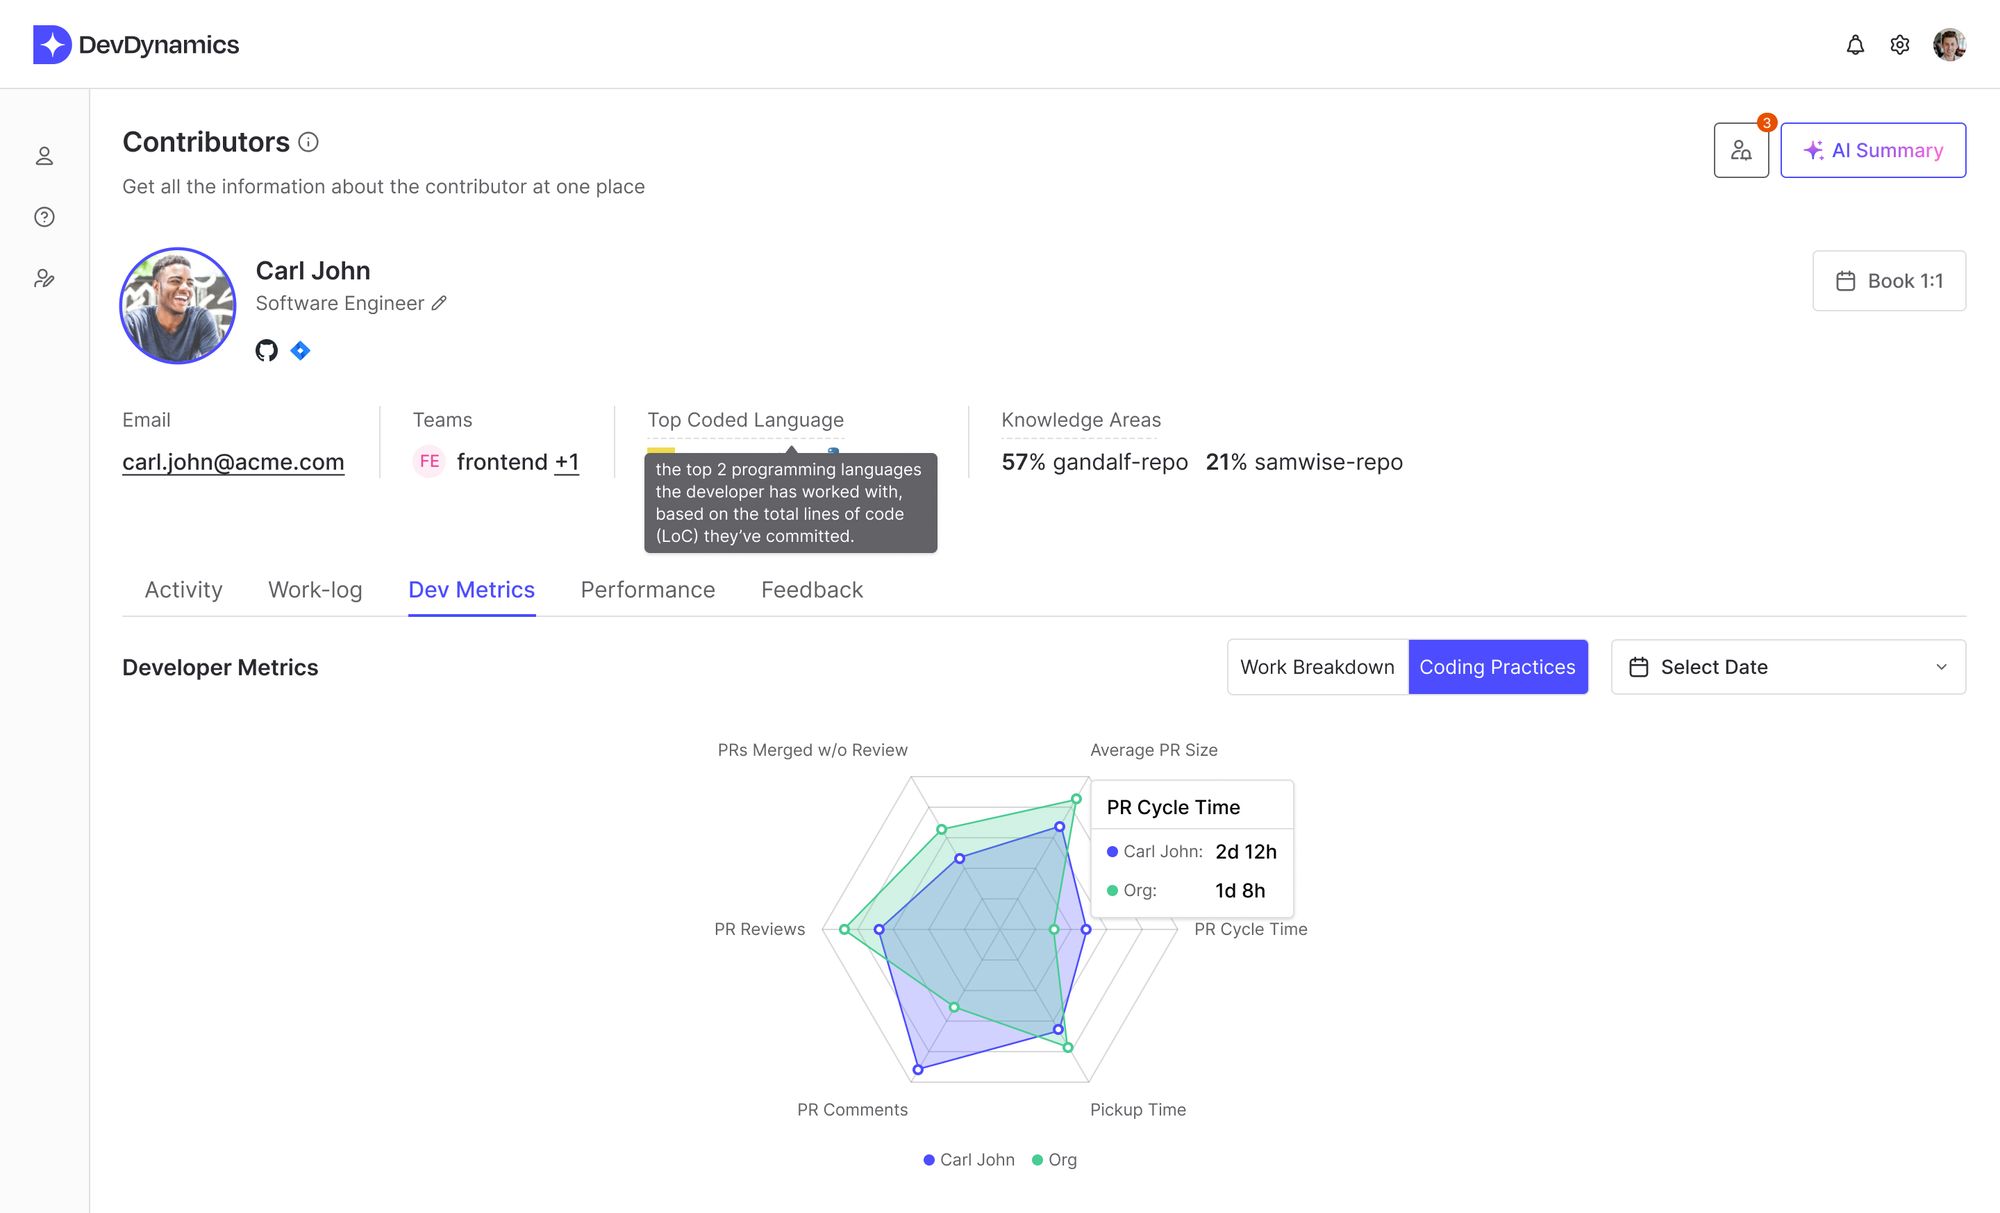
Metrics:
- Average PR Size
- Review Cycles (Merged with or without reviews)
- Pickup Time and Cycle Time
Code Quality Signals:
- Pinpoint PR comments and review habits to ensure healthy collaboration.
Not all “busy work” is impactful. Developer Metrics helps you separate signal from noise. This is where you spot strengths in practices (clean PRs, faster reviews) and coaching areas.
5. Performance Trends
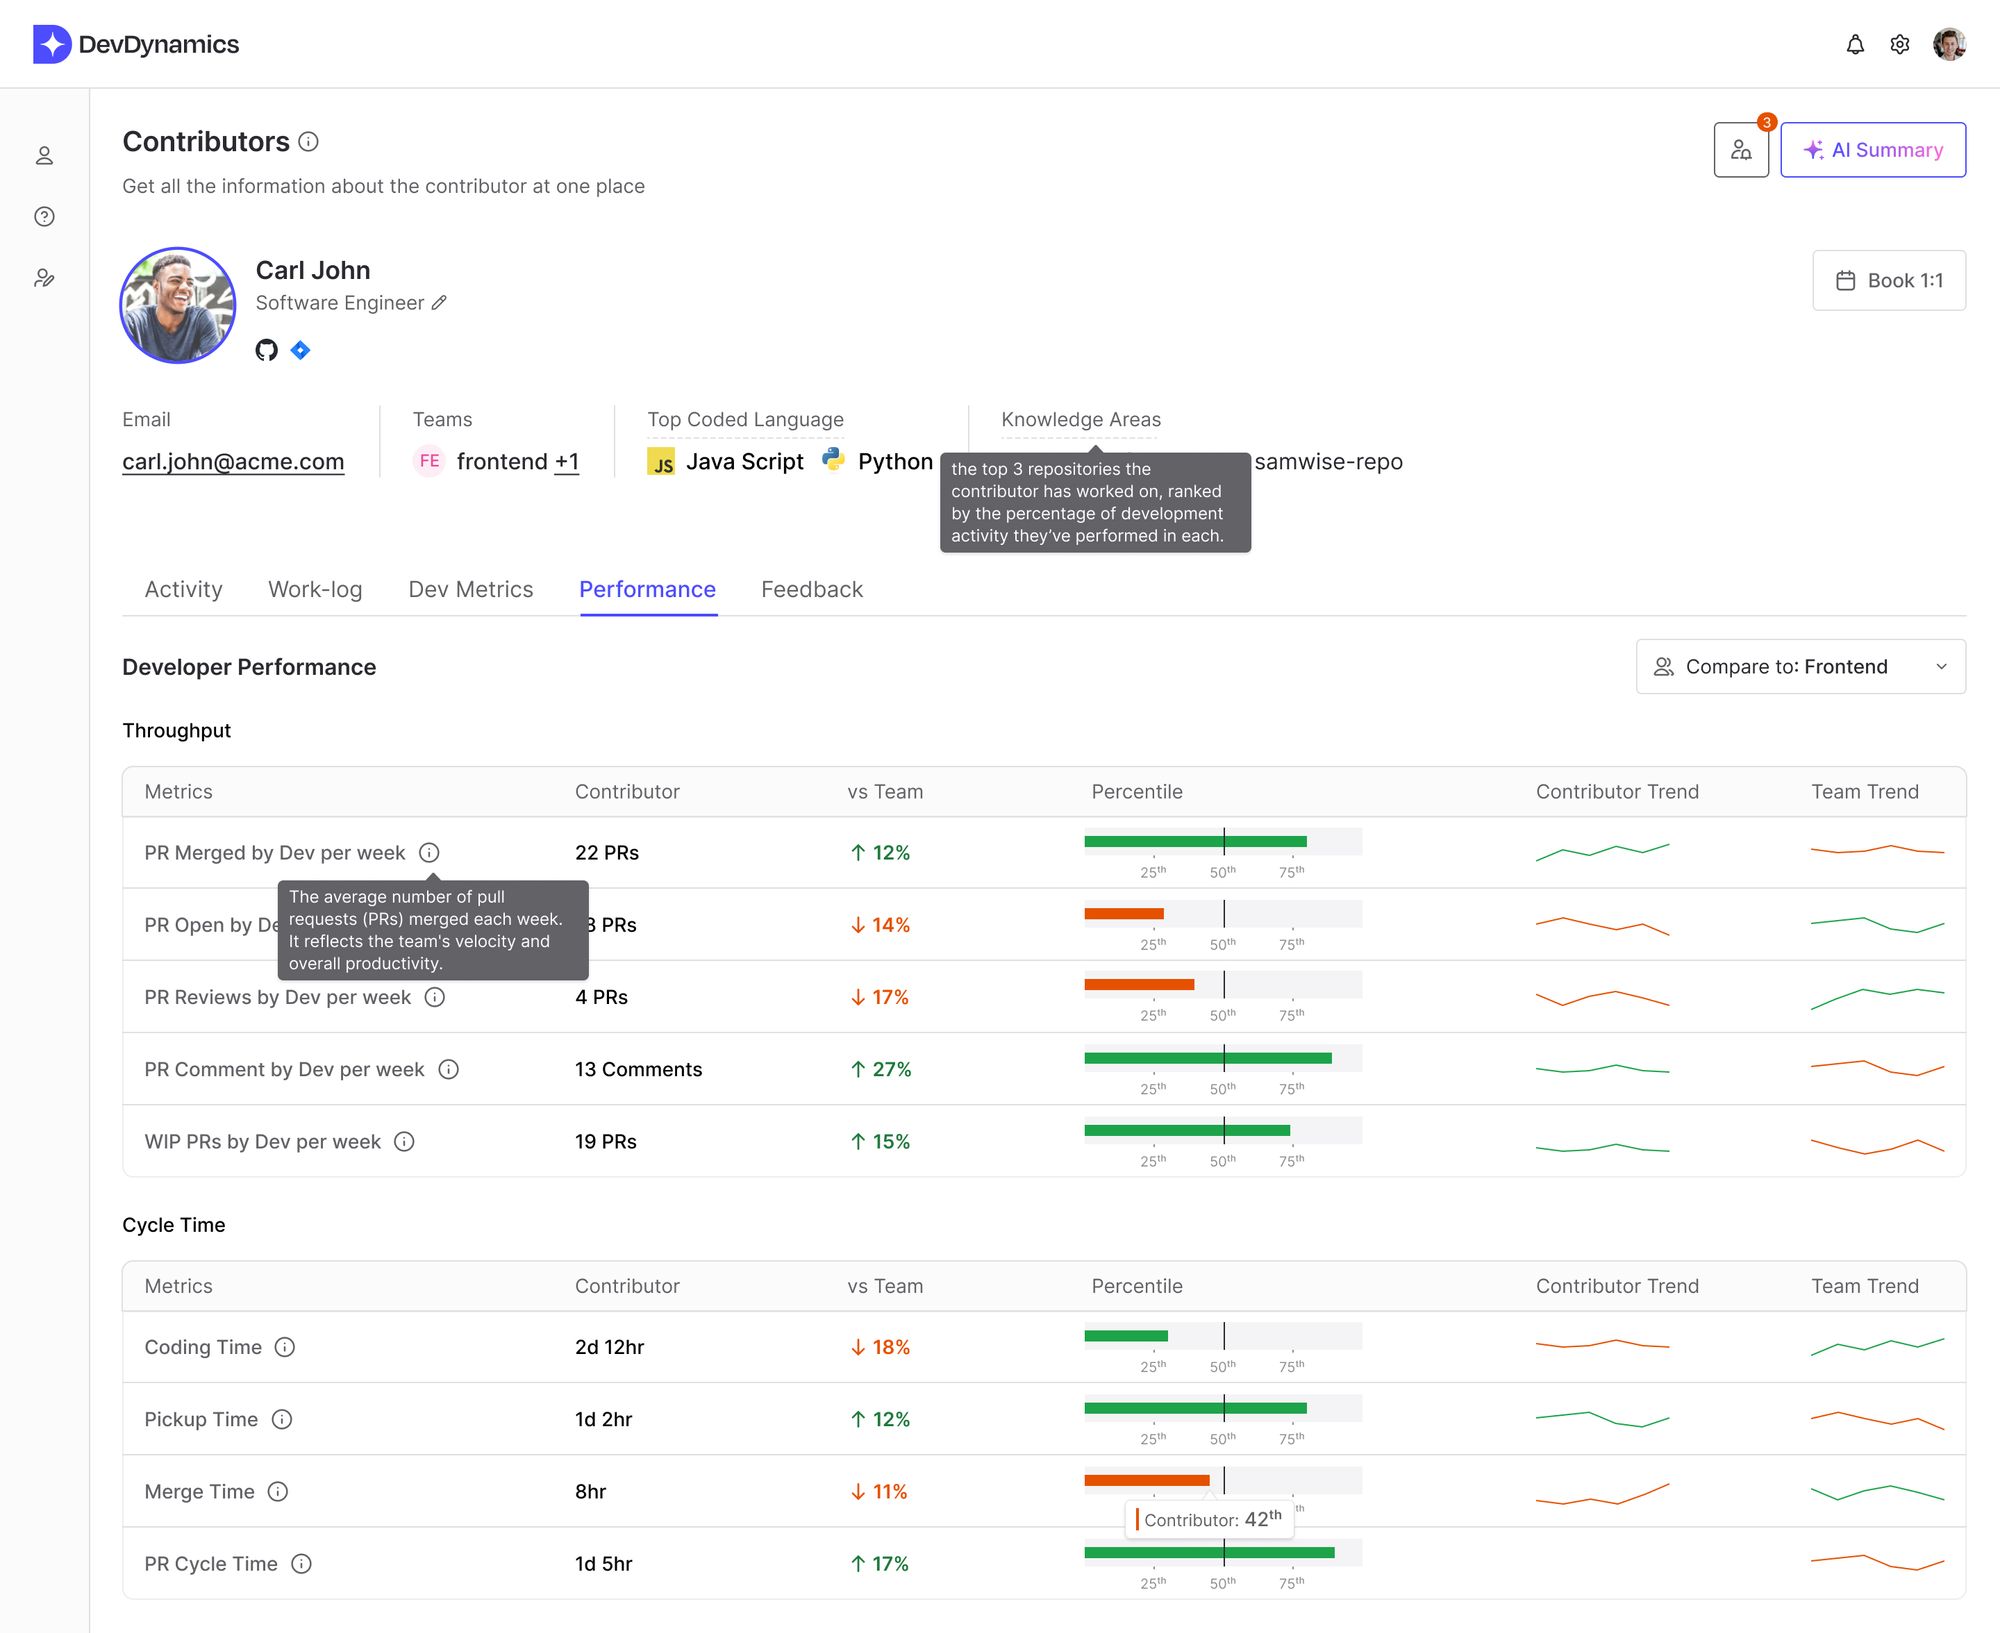
The Performance tab gives you trends that compare an individual’s contributions to team and org-wide benchmarks.
Throughput and Cycle Times:
- How fast are PRs being opened, reviewed, and merged?
- Where does their speed fall compared to team averages?
Workload and Health Metrics:
- Identify contributors carrying too much or too little work.
- Active Days vs. Overworking Trends: Balance matters.
This allows you to spot imbalances early, ensure no one is burning out, and provide tailored coaching for growth.
What They Do and How You Can Use Them
1. All Activity in One Place (not just git)
You know how tools like GitHub or Jira only show you one part of the story? Git tells you about commits. Standups give you updates on what’s “in progress.” But there’s always more going on. Developer Reports pull everything together: commits, PRs, reviews, bugs fixed, and even meetings, so you don’t have to go hunting for info.
You can see exactly what someone’s working on without wasting time jumping between tools.
2. Prepping for 1:1s and Reviews Is a Breeze
Before this, prepping for a 1:1 meant digging through Jira, GitHub, your notes, and Slack messages just to piece together what’s been happening. Now, you just check the report. It shows you what’s shipped, what’s stuck, and where someone went above and beyond.
You spend less time prepping and more time having real conversations about what matters.
3. Spot Strengths and Gaps Early
Sometimes you don’t notice patterns until they become problems like rework piling up or PRs staying open forever. Developer Reports highlight trends like this so you can see where someone’s doing great and where they might need some extra support.
You can jump in early to guide them instead of waiting for issues to blow up.
4. Turn Coaching into Real Progress
Coaching works best when it’s specific, right? With these reports, you can set clear goals, track progress, and show developers where they’re improving—like faster cycles, cleaner reviews, or better teamwork.
Growth stops being abstract and becomes something you can measure and build on together.
5. Self-Appraisals Without the Pain
Let’s be real: self-appraisals are a headache for most developers. They’re trying to remember what they worked on, which PRs mattered, and where they made an impact. Developer Reports solve this, it’s all right there.
They can focus on what they’ve done well, and you get a clear, honest appraisal without the back and forth.
Why It All Matters
At the end of the day, as an engineering leader, you want clarity. Developer Reports give you just that. You see what’s working, what’s not, and how to make things better.
Ready to level up your 1:1s, reviews, and coaching?
Explore Developer Reports on DevDynamics today.

