How to Use Developer Profiles for Performance Reviews

Let’s Talk About the Real Struggle with Performance Reviews
Look, we all know performance reviews can be a nightmare especially for engineering managers. You’re juggling multiple sprints, half a dozen project boards, a never-ending Slack feed, and a sea of GitHub notifications. On top of that, you’re trying to remember who fixed that critical bug at 2 AM, who spent hours mentoring a junior dev through messy pull requests, and who quietly tackled all those “small” tasks that made the product smoother. It’s basically impossible to keep it all in your head.
Meanwhile, developers often feel their best contributions go unnoticed. They might have refactored a gnarly codebase, saved a sprint by squashing last-minute bugs, or spent days reviewing teammates’ PRs. But unless they’re meticulously documenting every move, a lot of that effort slips under the radar.
That’s exactly where DevDynamics Developer Profiles come in. By pulling real-time data from GitHub, Jira, and CI/CD pipelines, we give you a single, holistic view of each developer’s work, no more frantically switching between spreadsheets or trying to jog your memory about who did what and when. You get clear insights into code commits, reviews, bug fixes, and collaboration patterns, all of it wrapped in a context that speaks to both outcomes and effort.
In this article, we’ll cut through the noise and show you how to use DevDynamics to run fair, data-backed, and (dare we say) enjoyable performance reviews. You’ll learn how to align the numbers with the human side of your team so you can recognize both the code that ships and the subtle, behind-the-scenes work that keeps everything running. Let’s dive in.
1. Start with the Activity Tab: A Big-Picture View That Needs Context

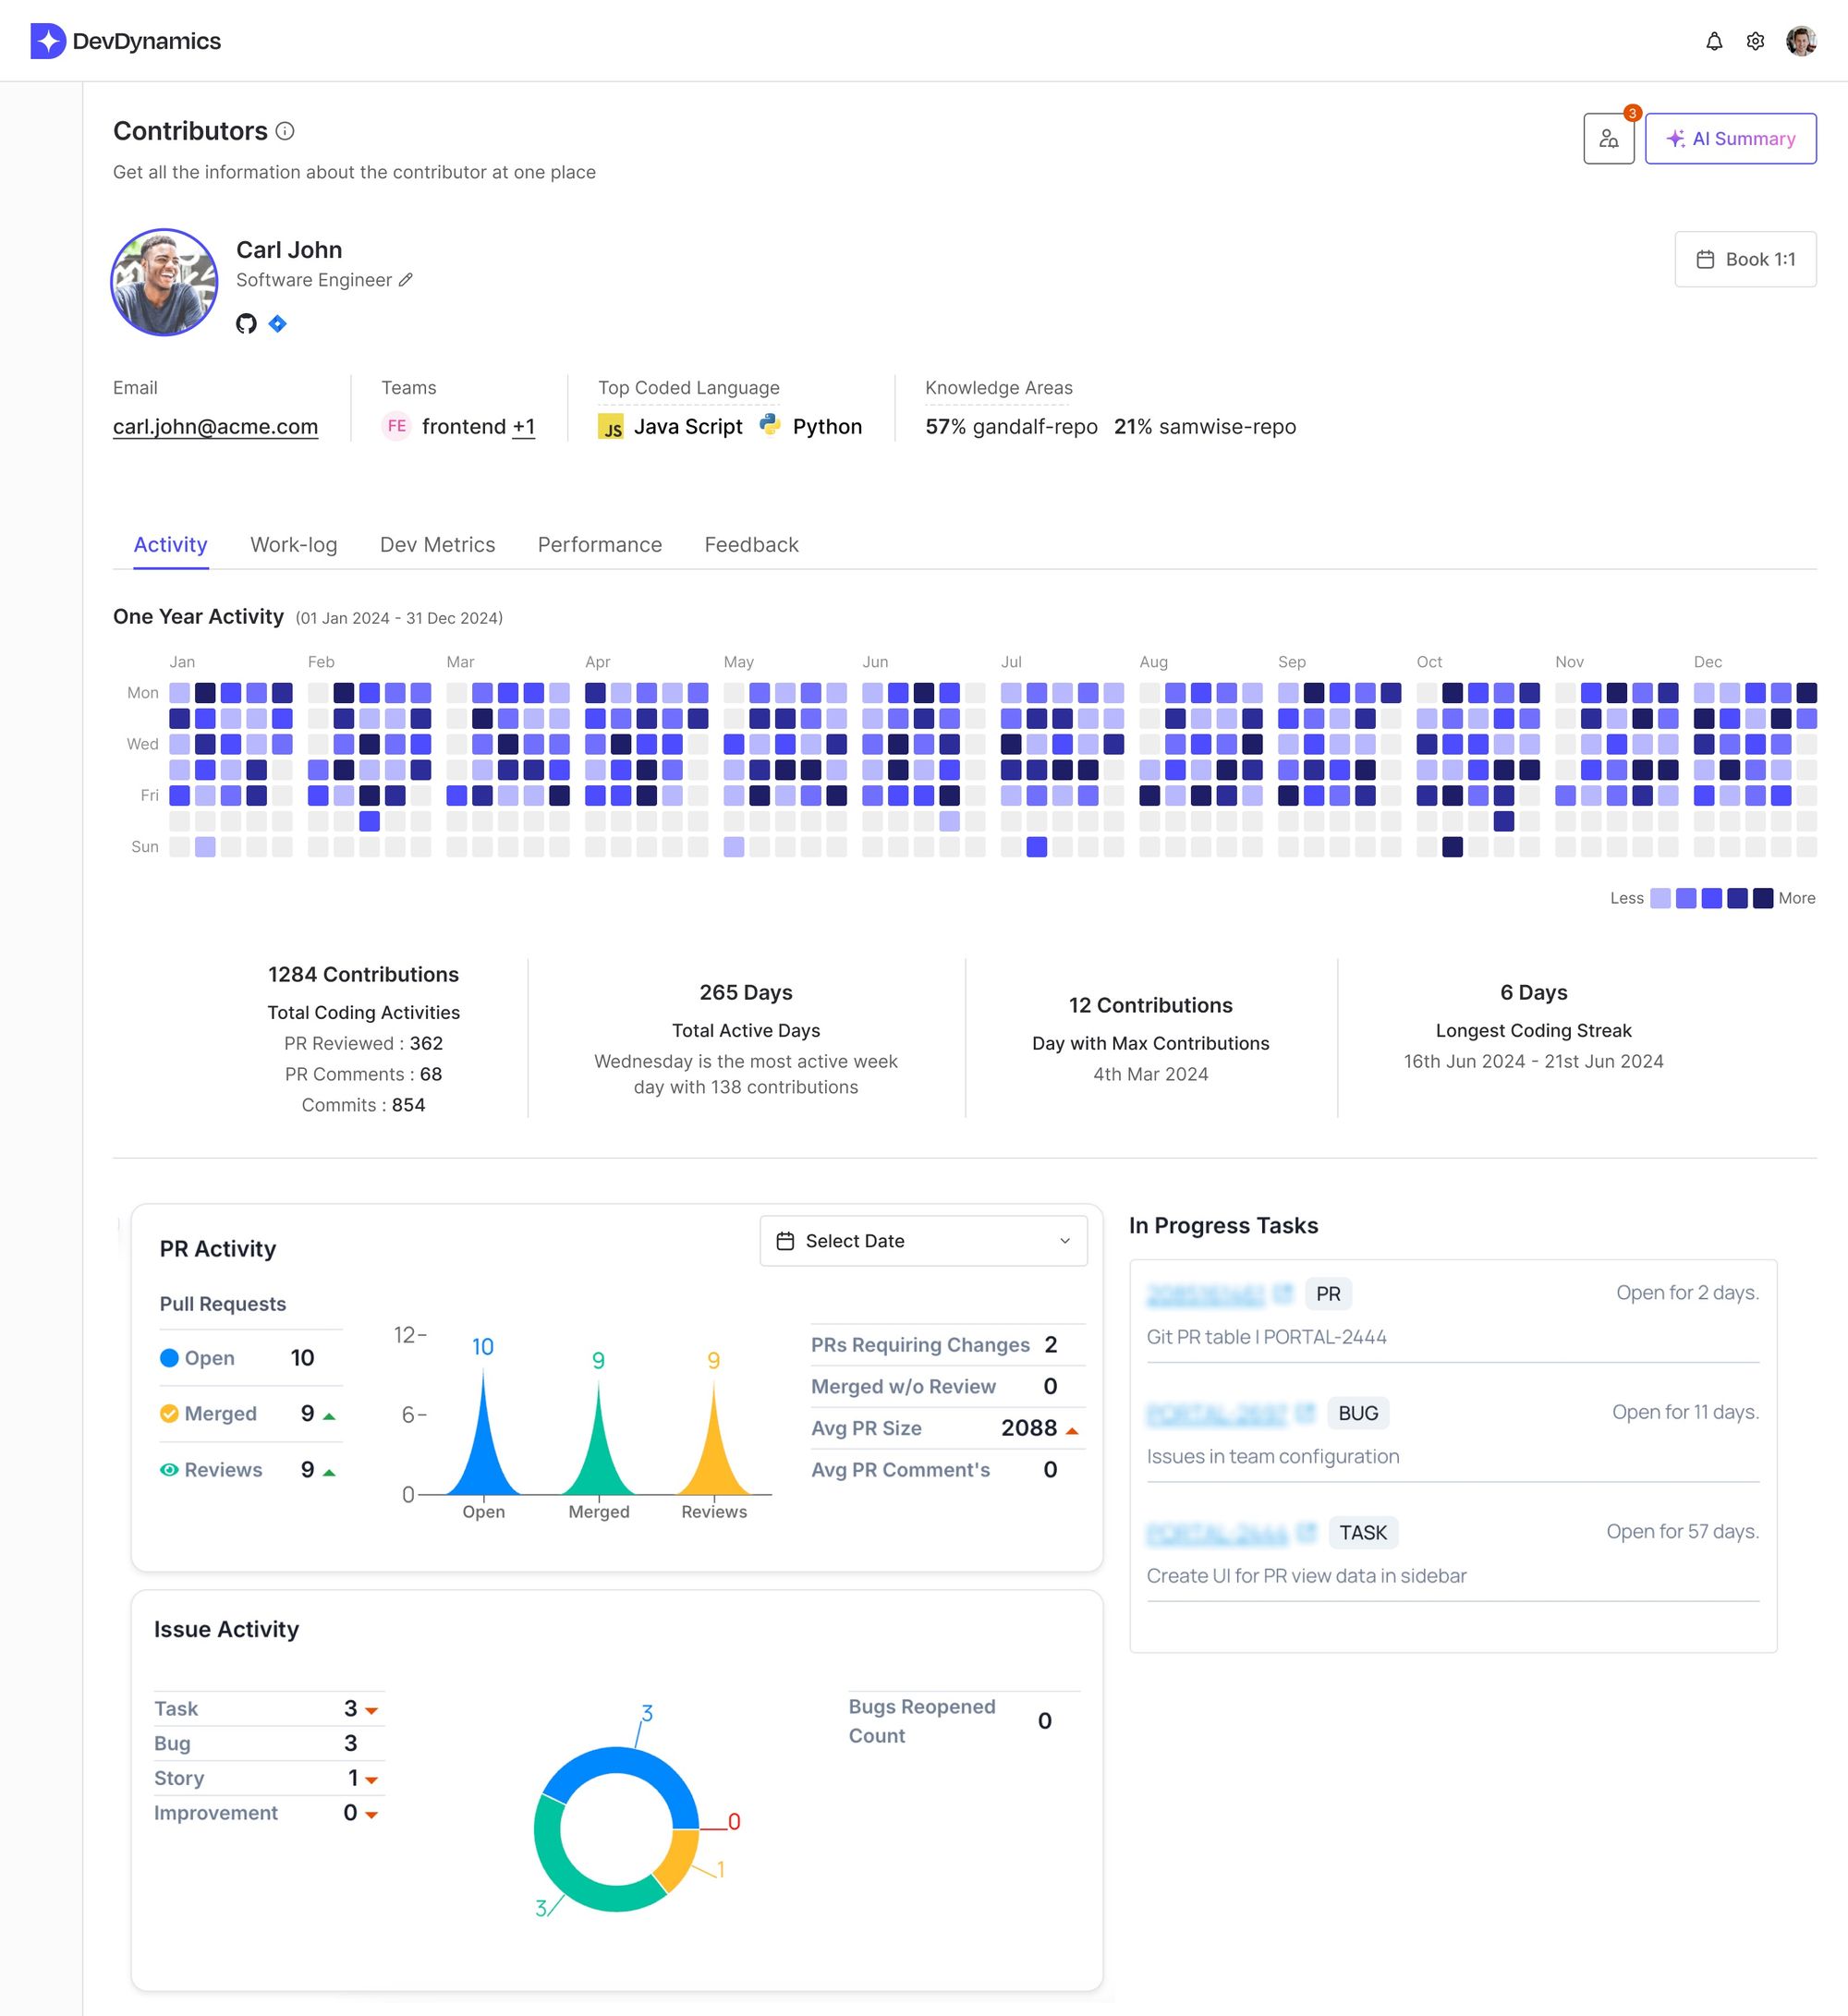
The Activity tab provides an overview of a developer’s engagement over time. You’ll find:
- Activity Heatmap
Pinpoints active and inactive days throughout the year. - Key Metrics
Total contributions, coding streaks, days active, etc. - PR & Issue Activity Breakdown
Pull requests opened, merged, and reviewed; tasks completed; bugs fixed.
How to Use It
- Spot Patterns: Notice periods with fewer merges or commits. Were they on vacation, or did they face blockers? Don’t assume dips indicate underperformance context is key.
- Embrace Non-Quantifiable Work: If you see many PR reviews but few commits, the developer may be mentoring junior teammates or focusing on code quality. Make sure these contributions aren’t overlooked.
- Discuss the Why: Use the heatmap to open a conversation about life events, major product changes, or other factors that influenced their work—rather than jumping to conclusions.
Pro Tip: Balance the visible metrics with an understanding of the developer’s role, recent product pivots, or personal circumstances. This ensures you’re not penalizing someone for a temporary dip caused by external factors.
2. Dive into Dev Metrics: Going Deeper Without Losing Sight of the Bigger Picture

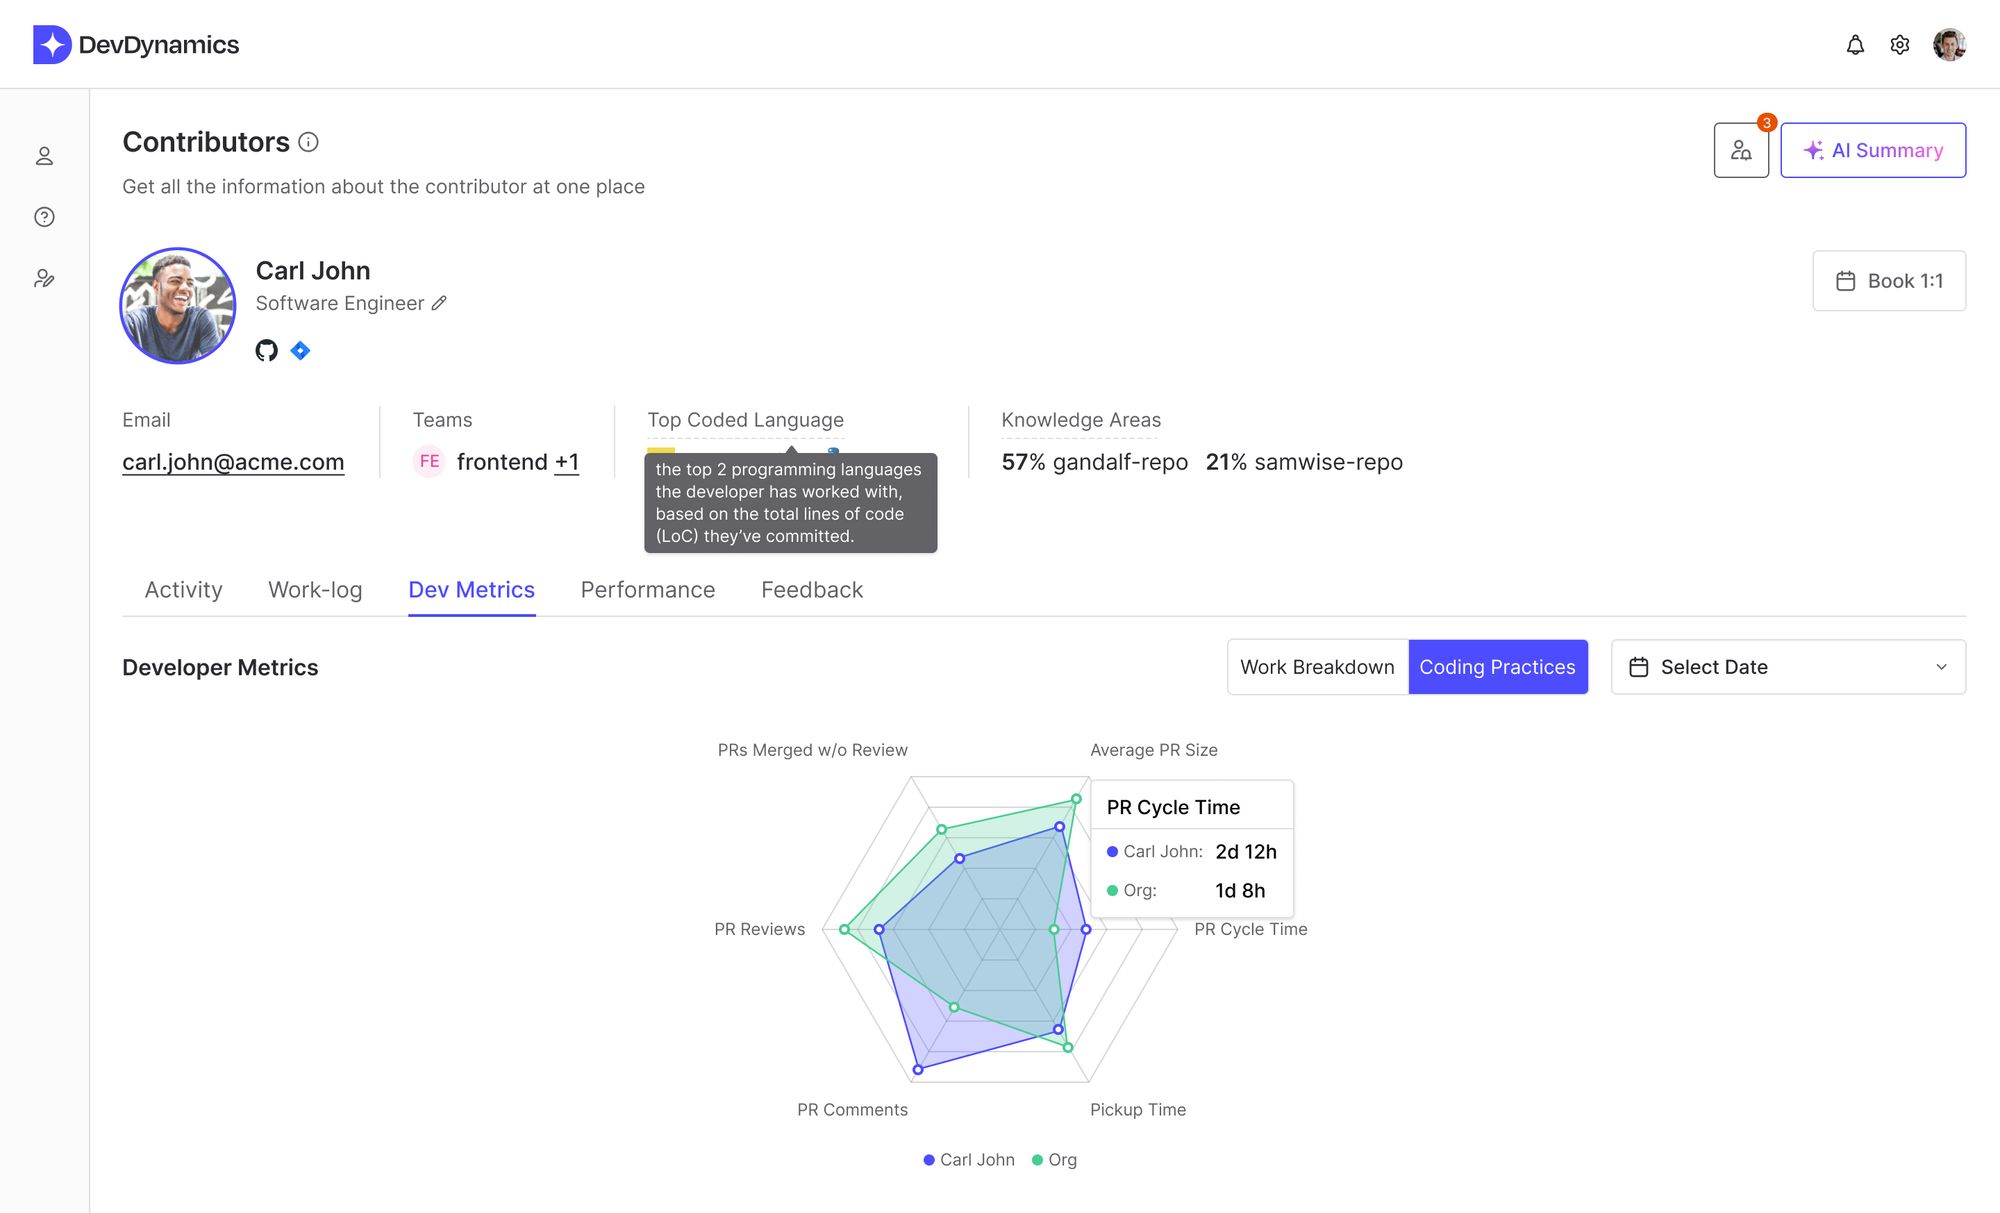
The Dev Metrics tab provides a deeper look at technical performance, such as:
- PR Metrics
Average PR size, PR cycle time, pickup time (time to start reviewing), etc. - Review Metrics
Comments per PR, PRs merged without review, review turnaround time. - Comparison to Team
See how an individual’s metrics stack up against overall team benchmarks.
How to Use It
- Identify Bottlenecks: If PR cycle times are consistently high, investigate possible causes complex features, lack of code reviews from peers, or personal workflow issues.
- Encourage Balanced Contributions: If someone is strong in coding but rarely reviews PRs, suggest taking on more mentorship responsibilities.
- Avoid Metric Tunnel Vision: High numbers aren’t automatically a good thing. A “longest coding streak” might signal burnout or a lack of breaks. Similarly, a developer might split large tasks into many small PRs just to keep metrics high.
Pro Tip: Quality Over Quantity. Don’t let the numbers overshadow how a developer impacts the team’s success, product quality, and knowledge-sharing culture.
3. The Performance Tab: Throughput & Cycle Times in Context

The Performance tab drills down into weekly or sprint-based metrics:
- Throughput Metrics
PRs opened, merged, and reviewed per week, plus comments made. - Cycle Time Metrics
Coding time, pickup time, merge time, and overall PR cycle time. - Trend Lines & Percentiles
Compare individual performance with team-wide trajectories.
How to Use It
- Prevent Overload: If a developer shows high review throughput (many PRs reviewed) but fewer commits, they might be bottlenecked by constant review requests or dealing with firefighting tasks.
- Spot Positive Trends: Celebrate improvements, like a drop in merge times or more consistent review schedules.
- Look at External Factors: A spike or dip in performance might correlate with a major product shift, a reorganization, or significant dependencies on other teams.
Pro Tip: Use these metrics to fuel improvement discussions. A downward trend could be temporary due to a complex project. Before taking action, always ask the developer for their perspective.
4. The Worklog Tab: Granular Visibility, Potential Micromanagement Pitfalls

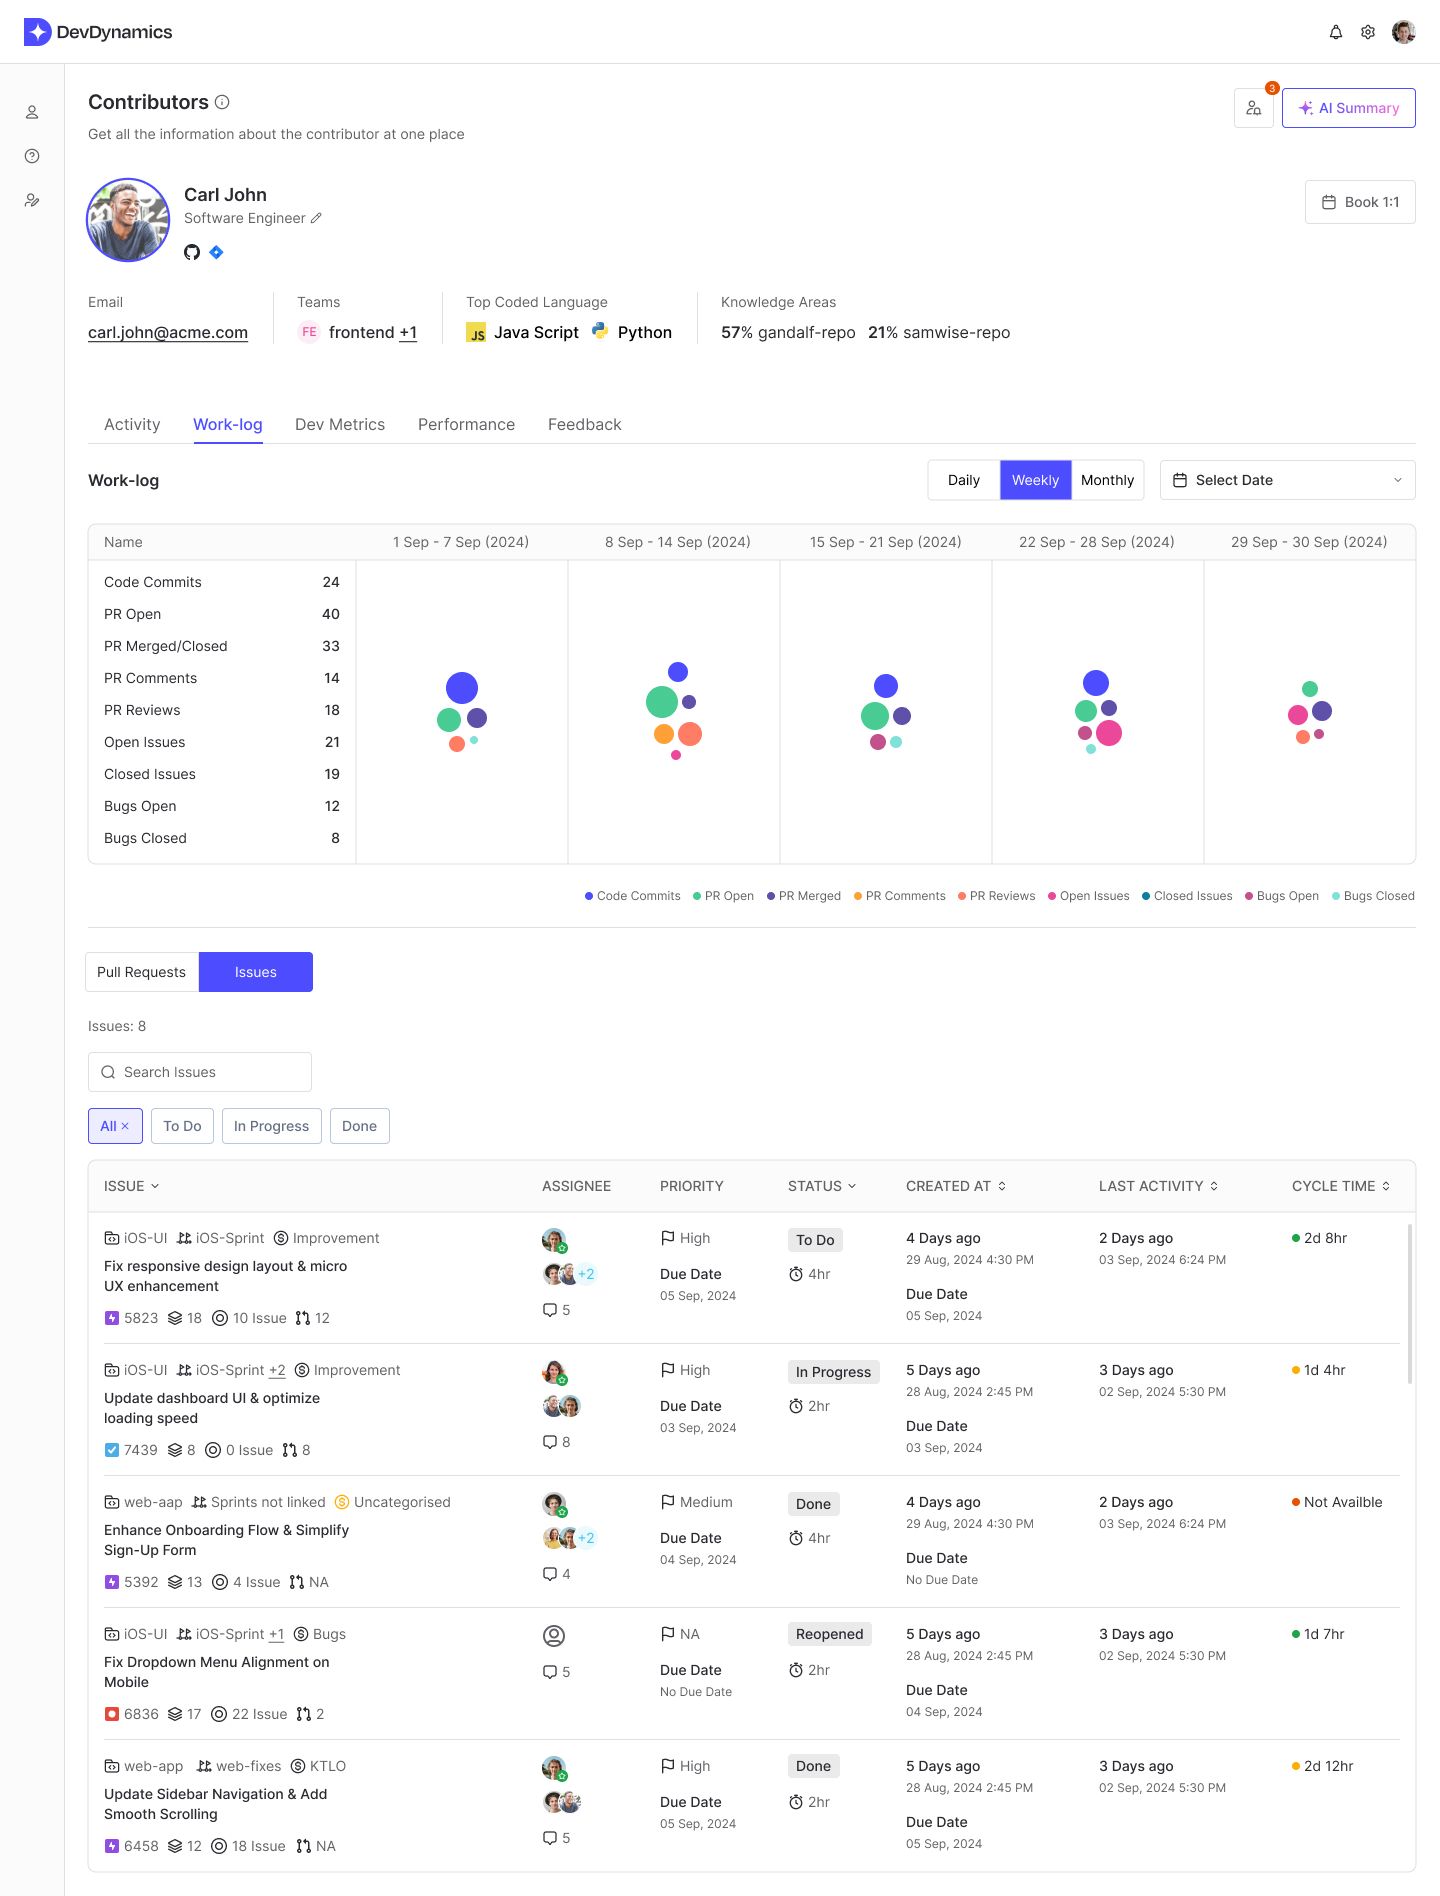
The Worklog tab shows daily contributions:
- Daily Activity
When PRs were opened, merged, or reviewed, and issues worked on. - Historical Context
Dive into specific sprints or projects to see how time was spent.
How to Use It
- Identify Blockers: If certain days are empty, ask if they were stuck waiting for design specs or approvals, or if they were focusing on tasks not logged in your system.
- Recognize Hidden Effort: Use data to acknowledge debugging, documentation, and other less-visible tasks.
- Beware of Micromanagement: Avoid nitpicking every single day of low activity. This data should prompt supportive discussions, not surveillance.
Pro Tip: Focus on Patterns. Everyone will have off-days or sprints that look “quiet.” Evaluate how daily activities link to sprint or project outcomes.
5. The Feedback Tab: Bridging Quantitative and Qualitative Insights
The Feedback tab encompasses peer feedback, manager notes, and personal goals:
- Peer Comments
Insights on code quality, collaboration, communication style. - Manager Notes
Observations tied to metrics or project deliverables. - Goal Tracking
Progress toward personal and team objectives.
How to Use It
- Close the Loop: If metrics show fewer commits but the developer is praised for onboarding new team members, you have a richer view of their actual impact.
- Address Underperformance Constructively: If the numbers dip and peer feedback is lukewarm, create a tailored improvement plan e.g., pair programming, additional training, or reassigning tasks that align better with their strengths.
- Celebrate Wins: Recognize peer feedback that praises their mentorship, problem-solving, or ability to unblock others.
Pro Tip: Combine numerical data and anecdotal evidence to form a complete picture before deciding on performance ratings or improvement areas.
Balancing Quantitative with Qualitative
1. Avoiding ‘Vanity Metrics’
It’s easy for developers to chase metrics (like commit counts or PR merges) rather than meaningful outcomes. Emphasize why the metrics matter, customer impact, product stability, and effective teamwork so the focus remains on results, not just numbers.
2. Keeping Context Front and Center
External factors such as organizational restructures, product pivots, family leave can drastically affect productivity. Whenever you see sudden spikes or dips, investigate the external context. Encourage open communication about potential blockers.
3. Fostering Trust and Respect
DevDynamics surfaces a lot of detailed information. Make sure your team understands what data is collected, why you’re collecting it, and how it benefits them. Transparent policies and respectful communication prevent the platform from feeling like Big Brother.
4. Handling Underperformance
When metrics consistently show underperformance:
- Start a Dialogue: Ask open-ended questions to understand any personal or team-related challenges.
- Set Clear, Realistic Goals: Create SMART (Specific, Measurable, Achievable, Relevant, Time-bound) targets.
- Offer Support: Provide resources like pairing sessions with senior developers or training opportunities.
- Track Progress: Follow up regularly to see if metrics are improving, and always pair the data with qualitative feedback from peers and the developer themselves.
5. Planning Career Growth
Not every developer is aiming for management; some prefer technical leadership or specialized domains. Use metrics to spot strengths like high-quality code reviews or consistent improvements in cycle time and discuss how they can progress. This might mean leading a new feature team, becoming a domain expert, or mentoring others.
6. Accounting for Different Roles and Team Dynamics
A back-end engineer tackling complex system architecture will have different patterns than a front-end dev focusing on UI tweaks. Compare apples to apples; align each role’s metrics with relevant KPIs. Also, keep in mind the team-based nature of most development efforts celebrate collective achievements and cross-collaboration.
Putting It All Together: A Framework for Your Next Review
- Check Activity for High-Level Trends
Use the heatmap to see big spikes and dips, then supplement with discussions about why they happened. - Dig into Dev Metrics
Identify any red flags (e.g., long PR cycle times) but frame them within the developer’s context and role. - Review Throughput & Cycle Times in Performance
Discuss possible process issues (like slow reviews) or complex tasks requiring extra time. - Confirm Day-to-Day Patterns in Worklog
Pinpoint significant debugging periods, or times spent on design and planning. - Incorporate Peer & Manager Feedback
Balance quantitative data with comments on collaboration, problem-solving, and mentorship. - Co-create Actionable Next Steps
Whether the goal is reducing PR pickup time or fostering leadership skills, ensure each target is clear and realistic. - Manage Data Responsibly
Maintain privacy, communicate openly about data usage, and respect the developer’s perspective at every stage.
Conclusion: Metrics as a Means, Not an End
DevDynamics Developer Profiles provide powerful data for performance reviews, but numbers alone never tell the full story. By combining real-time, automated insights with a human-centric approach contextual discussions, peer feedback, and clear improvement goals you can transform reviews into genuine growth opportunities.
- Focus on meaningful impact, not just raw metrics.
- Use context to interpret highs and lows.
- Treat data as a conversation starter, not a final verdict.
- Keep the emphasis on trust, collaboration, and career development.
With DevDynamics, you can streamline your performance reviews while ensuring they remain fair, transparent, and above all, deeply supportive of each engineer’s journey both as a contributor to the team and as a professional growing in their field.

